Add visual support to your valuation estimates with Titan Analytics
Written by a la mode on September 26, 2017
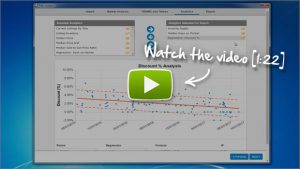
Now I know you think that there’s no way you have time for that. But, with tools like Titan Analytics, you won’t waste time creating them. In fact, Titan Analytics does it for you. Click the video below to learn more.
In addition to completing the 1004MC, use Titan Analytics to create credible charts and graphs to communicate market data and trends to your clients automatically. It’s rapid-fire visual support for your appraisal, which could mean the difference between hours of useless questions or sailing through your review. And on private clients, it enhances referrals and support for high fees.
Titan Analytics has over a dozen options, from GLA and Days on Market to several regression analyses. Each chart of graph you choose is placed into an Analytics Addendum inside your report, describing visually to your clients the market elements that helped you reach your opinion of value. Or, if you’d rather just save them in your Digital Workfile, Titan Analytics has exporting options so you can do that too.
Create an impressive analysis and complete the 1004MC in five minutes or less without leaving TOTAL. Dive in for just $199 per year, or upgrade to the Elite System and get it included. There's no per-report fee, so use it as much as you'd like. As always, your purchase is backed by our 100-day, money-back guarantee.
{{cta('5b35974a-ddb3-4af9-b1ac-3dca3fbe5a88','justifycenter')}}
Previous installments of our Titan Analytics Tech Tip series:
- Tech Tip: Precisely calculate Days on Market
- Tech Tip: Add your own comments to describe seller concessions and foreclosure trends
- Tech Tip: Titan Analytics' intelligent mapping makes working with any MLS possible
- Tech Tip: Run both the single-family and condo analyses at the same time with Titan Analytics
For more information on things like how to get started with Titan Analytics, instructions for exporting from your MLS vendor, and frequently asked questions click here.
Sign up for a FREE 30-minute webinar where we'll walk you through the ins and outs of Titan Analytics from importing your MLS data to adding charts and graphs to your report. Click here to save your seat ›