Dynamo MC now includes polynomial regression
Written by a la mode on May 27, 2015
This is a guest post from Bob Cirilli, founder of Perfectly Normal Software, LLC. You can read his last post here, or check out the Dynamo MC 1004MC automation tool in the TOTAL Store here.
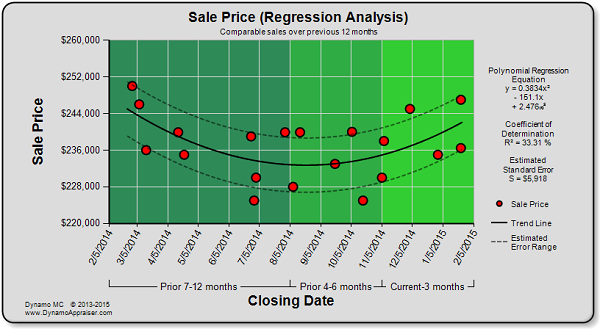
The latest version of Dynamo MC now features polynomial regression, so you can use curved trend lines to explain the changes in your market. Since change doesn’t always occur along a straight line, a curved trend line may be more appropriate – especially in changing and seasonal markets.

You can select the trend line you’d like to display on each chart. Alternatively, you can let Dynamo MC choose the best trend line for you. This automatic setting uses cross-validation to find the best fitting trend while reducing “overfitting”. (Overfitting occurs when an overly curved line is used when a less complicated trend would have sufficed.) This is an advanced statistical feature you won’t find in any spreadsheet program.
In addition to polynomial regression, Dynamo MC still provides a fully populated 1004MC, compatibility with nearly every MLS, a huge variety of charts and reports, and a simplified workflow that can save up to 30 minutes on every appraisal. Most appraisers could save 10 hours a month (or more), so you owe it to yourself to try Dynamo MC.
We’ve also reduced the price of our monthly subscription to $49 a month. A free trial is available in the TOTAL Store, so you have nothing to lose.
About Dynamo MC

Works with nearly every MLS
Generates amazing charts and reports (Click to see all charts available in Dynamo MC)
Completes the entire 1004MC form
Polynomial Regression analysis featuring GLA and other market metrics
Integrates seamlessly with a la mode TOTAL and WinTOTAL Aurora
New low price! Only $49 per month for unlimited reports!
Free trial available in the TOTAL Store
Learn more about Dynamo MC at www.DynamoAppraiser.com.