Appraisers do it better — using market trends to support opinion of value
Written by Becka Champagne on November 7, 2018
There have been a lot of big announcements in the last few months regarding investor requirements for market trending analysis. USPAP, Fannie, and Freddie are all adamant that appraisers still have to document market trends and neighborhood conditions, but haven’t really spelled out what they require to be documented.
When speaking with appraisers, there was some initial confusion on what was considered a market analysis. A lot of appraisers equate that term with what realtors provide to their customers, but in reality, the term market analysis means so much more.

In an article on PropertyMetrics’ website, Kimberly Goodwin Ph.D. eloquently defined a market analysis as, “A comprehensive picture of the subject property, location, neighborhood, and the larger market economic drivers. It should also provide conclusions about the changing demographics and regulations in the neighborhood and how those factors, as well as economics, could impact the subject property.”
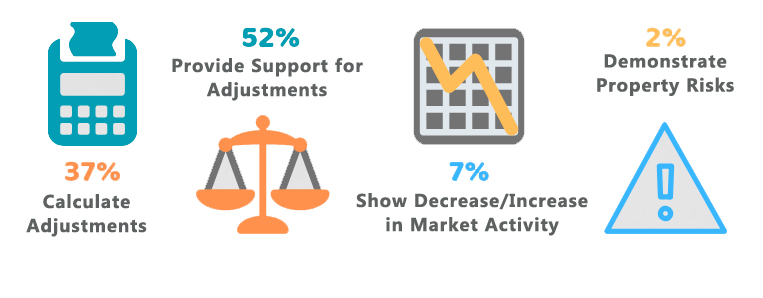
We published a blog and survey on this in late August, and found that many of you approach your analysis quite differently. Out of almost 3,000 appraisers, the majority of you wanted to be able to visually represent trending with data points such as bedroom count, lot value, number of baths, age, date of sale, etc.
What appraisers want from their market analysis tools
After reviewing thousands of responses, we felt what would be really helpful to appraisers like you, is to read what some of your peers are doing. We spoke with two appraisers from vastly different areas to find out how their analysis helps them stand out from the crowd.

Bob switched professions in 2003, from school teacher to certified residential appraiser. He’s also a part of The Appraisal Coach, Dustin Harris’s, Masterminds group that meets every few months, to discuss industry changes. Bob is based in Salem, Oregon and has found his method of trending analysis works well for smaller metropolitan areas.
Bob’s Approach
Bob treats his market analysis the same on both lender and non-lender orders. He uses the same analysis on every appraisal and displays it differently depending on the form. “I used to do my analysis separate for every report, but I’ve found going out once a month and updating all of my areas gives me the same results. It’s actually pretty quick by doing large data gathering all in one day instead of with each inspection. One of the most import parts is how you define your neighborhood.”
He groups his neighborhoods using school districts, amenities, type of build, etc. Bob put’s himself in the buyer’s shoes to determine if the subject property was no longer available, what other properties they’d be interested in.
Over the years, Bob has built friendships with realtors, police officers, and landlords. “Keeping up with the community news and communicating with agents or other professionals is necessary to stay on top of housing and real estate changes.” This is one of the biggest reasons Bob has turned down orders when the subject isn’t in his coverage area.
Bob’s Analysis
Once a month he’ll go into each neighborhood and analyze the market trends for that area and the data into a spreadsheet template. His advice is to, “At the bare minimum be sure your data covers all of the selling seasons. We all know that the market changes with the seasons. This is why I compare the prior 12 months to the previous 12 months for a total of 24 months. It is important in my opinion, to use a plotted graph as it depicts a more accurate trend over the past year. For example, it may reflect a steep increase over the first six months, but then a small decline in the last six months.”
Bob’s Final Thoughts
“Look at the whole picture of the data your pulling and make sure it’s reasonable. If it seems out of line, be sure you’re removing your outliers and analyzing what is typical for the area. It’s not perfect, but it does accurately reflect the current market trends.”

Mike’s been appraising for the last 15 years. He’s seen a lot of changes in the industry since 2003. We asked how his approach to trending analysis has changed for him since he started, this is what he had to say.
Mike’s Approach
“You know, you’re constantly evolving how you look at things, and your efforts to analyze data change as you learn and new data becomes available in your marketplace. I went from using basic compared sales and finding out that really didn’t work, to group sales analysis and linear regression. I’ll grab what I consider the market area in my MLS and pull three year’s worth of sales. I’ll run it through my spreadsheet and see if it’s relevant enough or if I need to expand my data pull. Then I tweak it as I review until I get to what I feel is most indicative of my subject property.”
He feels data points such as number of sales, foreclosure rates, listing and sales prices, allow him to better define his markets for each report and determine how he selects properties within his MLS.
In our survey, over 25% of you indicated that you’ve had to justify your market analysis. When we asked Mike how he’s handled those questions from clients, he was pretty candid. “I used to get really irritated having to justify my results, but then I realized the person on the other end was just trying to do their job. At the end of the day, my appraisal affects someone trying to buy their home and a Realtors’ transaction. I might be a little paranoid in the breadth of my data gathering, but I want to make my valuations as defensible as possible with the data that I have analyzed.”
Mike’s Analysis
The importance of market analysis for Mike is to determine what are his best comps, and what adjustments are fair and supported. He spends the vast majority of his time inspecting the subject, selecting comps, and calculating adjustments, instead of on the 1004MC. “I think that my custom Excel spreadsheet has much better information and so I rely on that, versus the more restrictive parameters of the 1004MC. So while I have always filled it out, I don’t put much weight on it.”
He’s very detailed in his commentary to explain anytime his report comes in under value. He keeps his spreadsheet in his workfile instead of displaying the entire breakdown. Of course, in 15 years he’s had requests to show his work or support his opinion and so far, has been able to come back and just copy and paste from a specific section of his spreadsheet. He uses some charts and graphs to reflect days on market, number of sales, price per square foot, etc. He feels they make the report more professional and help support how he got to his numbers.
Mike’s Final Thoughts
“Document what you’re doing, how you did it, and where you got your data from. Rule of thumb: Say what you did, and do what you said.”

No matter how you’re currently doing your market trending analysis, be sure you’re documenting it effectively in your reports. Until we know what form is coming next, it’s always safe to err on the side of caution. And of course, the more explicit your commentary and supporting evidence, the less likely you are to get revision requests.
Looking for ways to improve your market analysis? Register for one of our free classes on Getting Started with Titan Analytics.
{{cta(‘f280110d-60db-4c49-b0a4-c70afbcd8161’)}}