You provided feedback, and we heard you! We’ve made exciting updates to Titan Analytics. These new improvements offer clearer support for your valuation and adjustments and give you the ability to create and customize graphs.
Easily reflect how your subject and comps relate to your market from your MLS import, and create graphs using the newly added data points or customize an existing one. When you’re finished, simply name your new graph, and export your Analytics Addendum straight into TOTAL or Titan Reports. Plus, your Analytics Addendum contains additional commentary from your market data and can be used with, or without, a 1004MC.
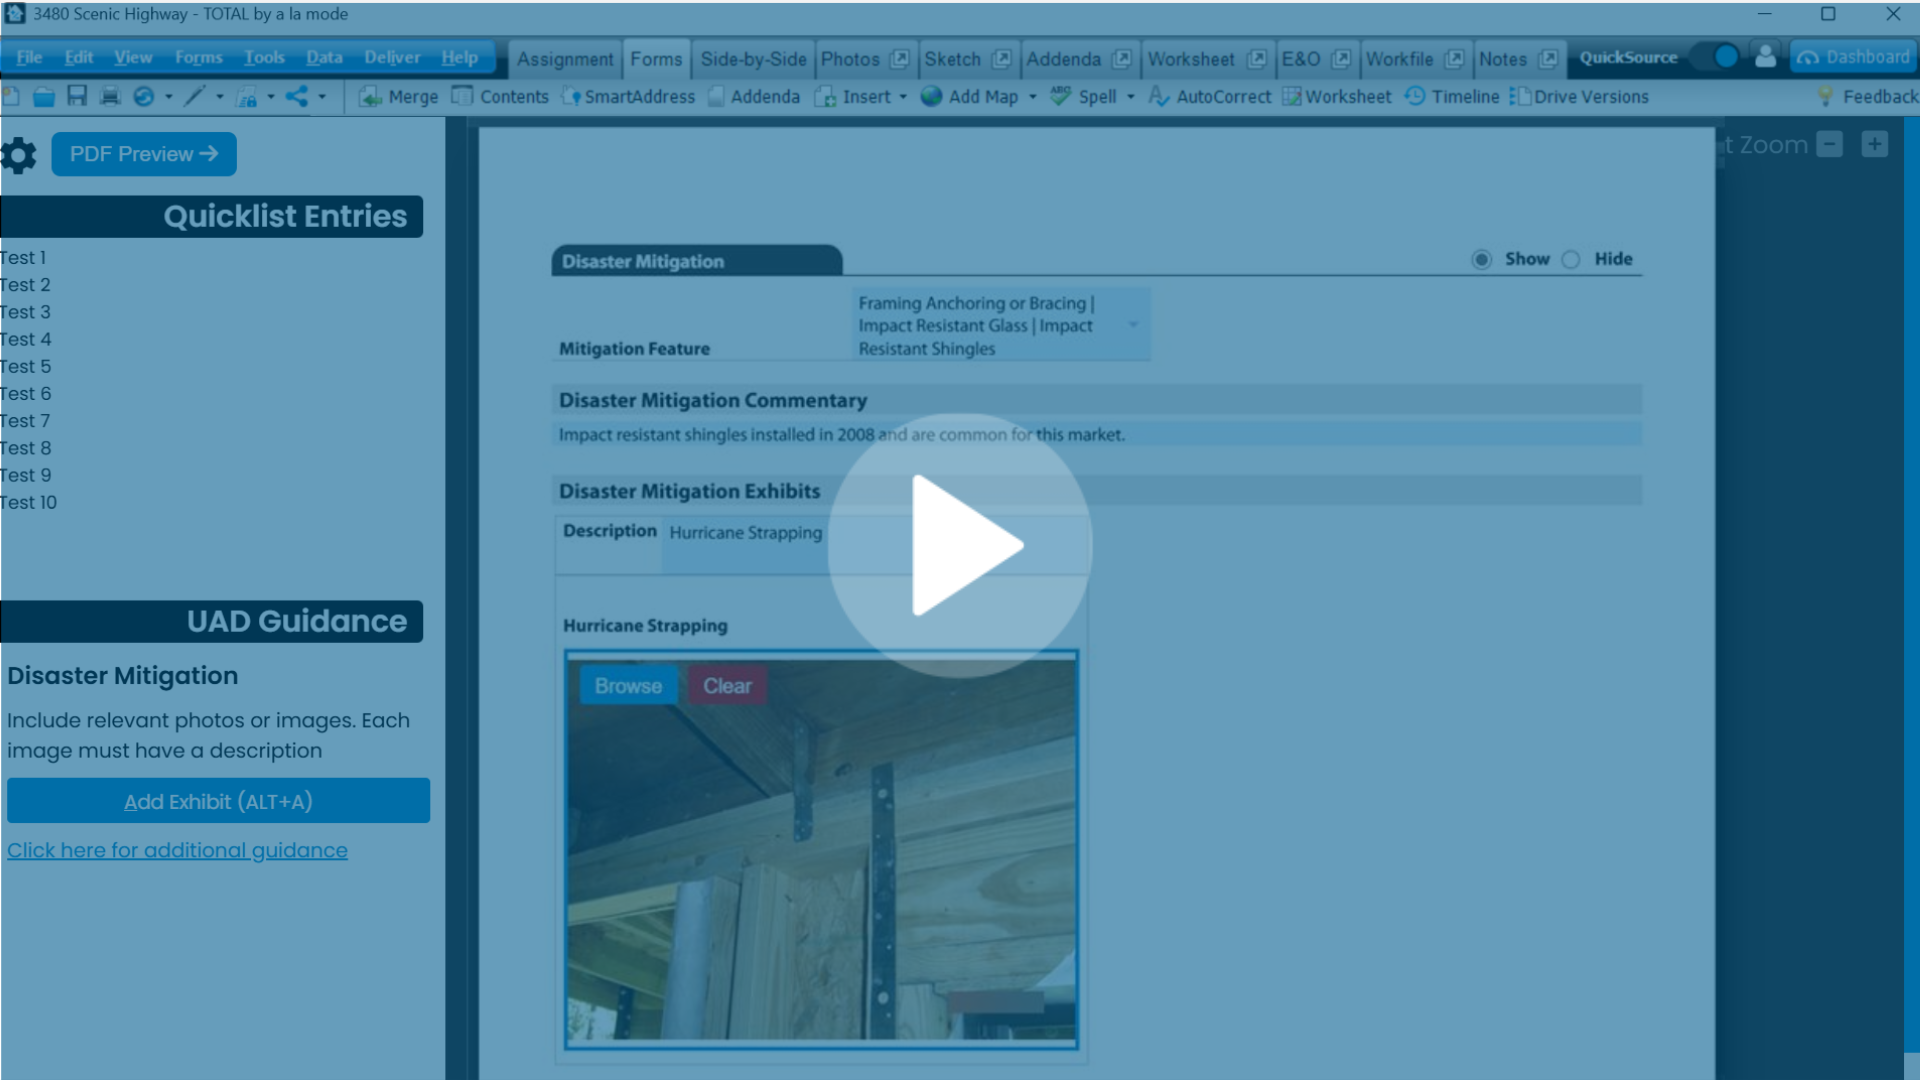
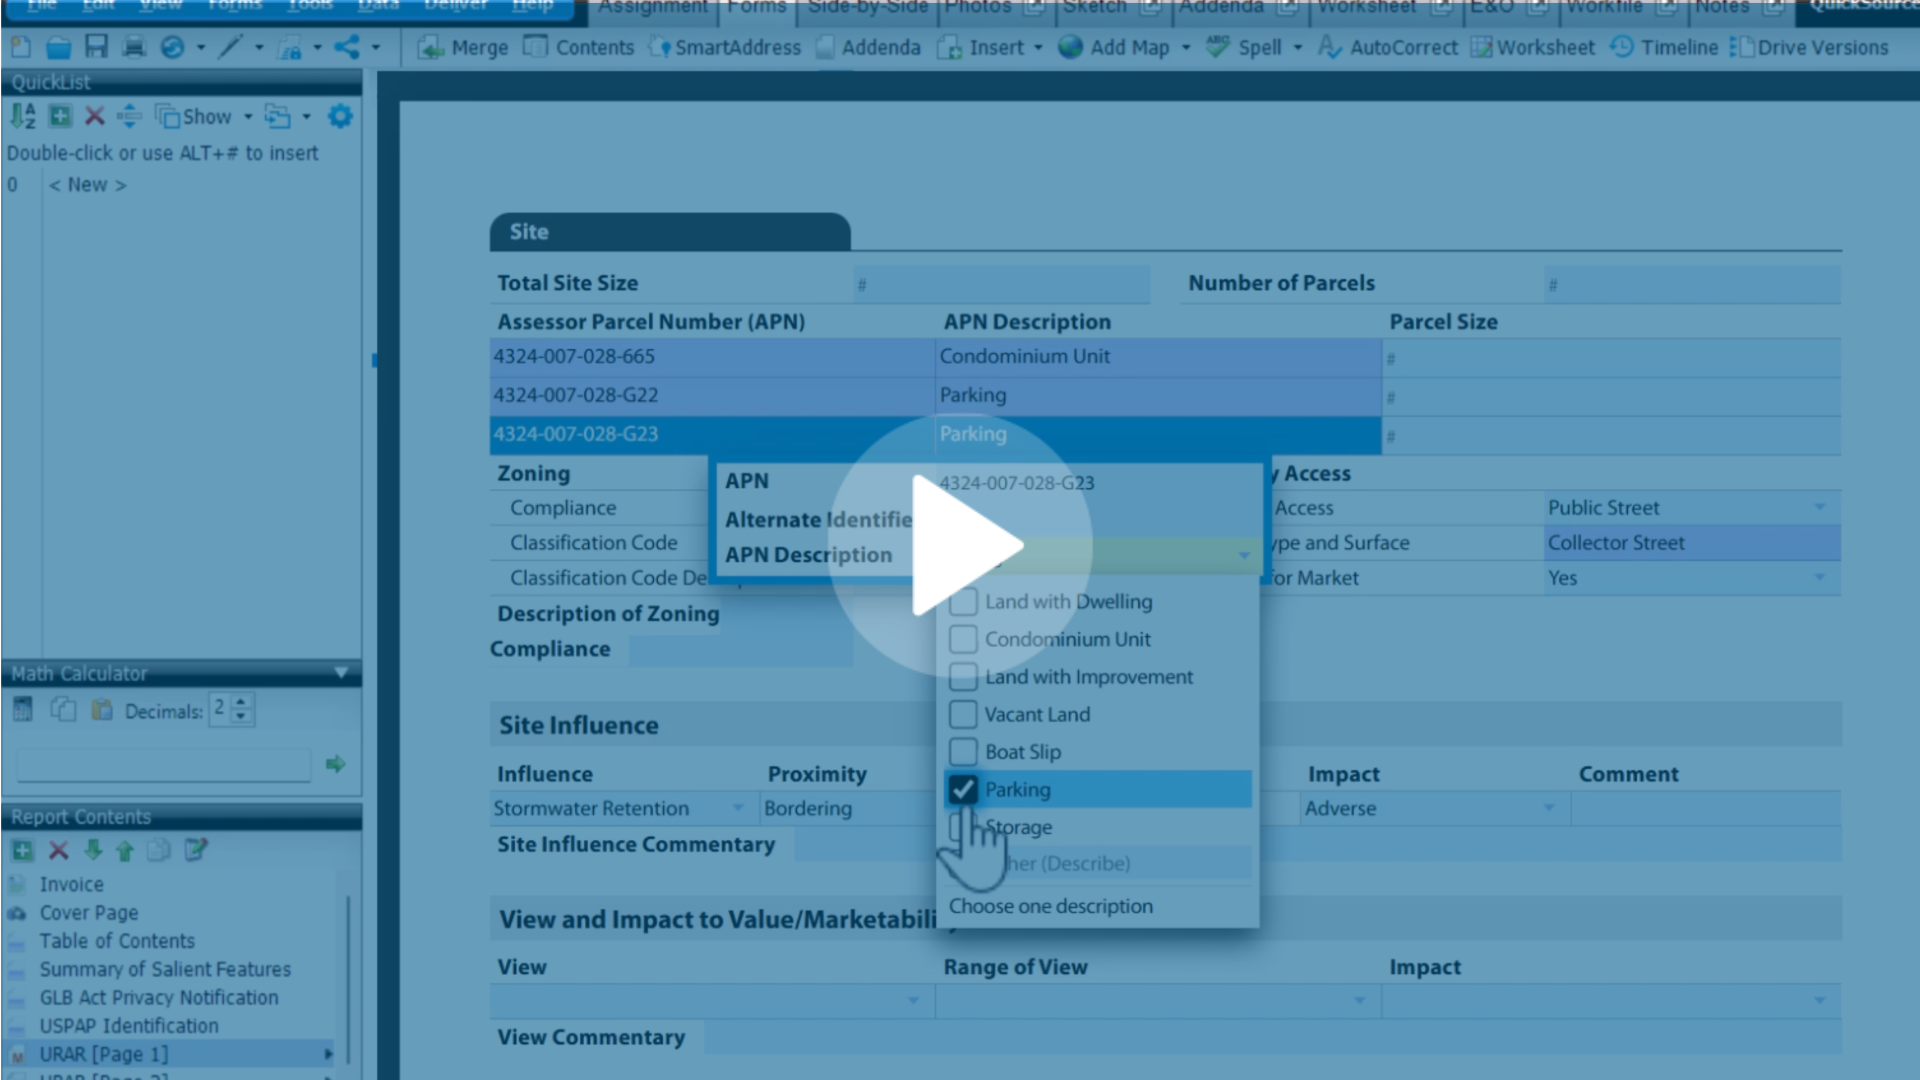
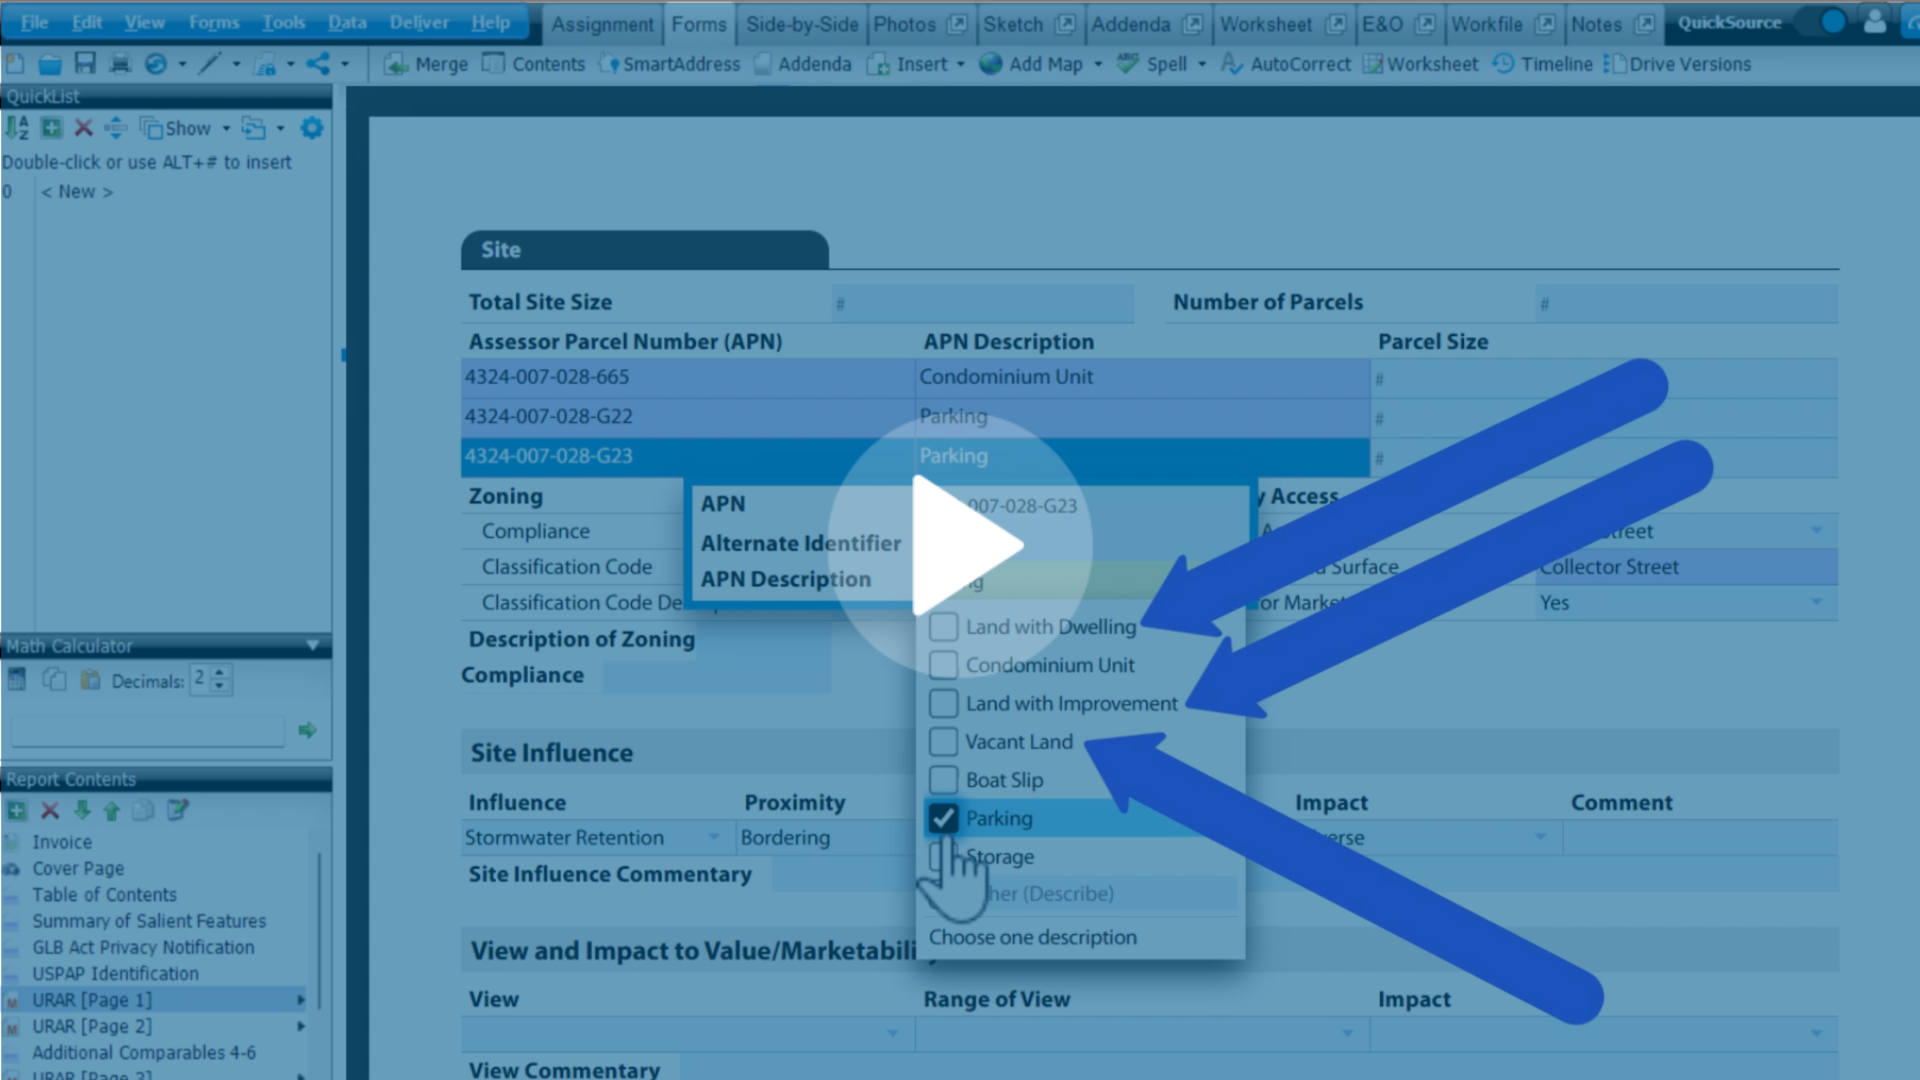
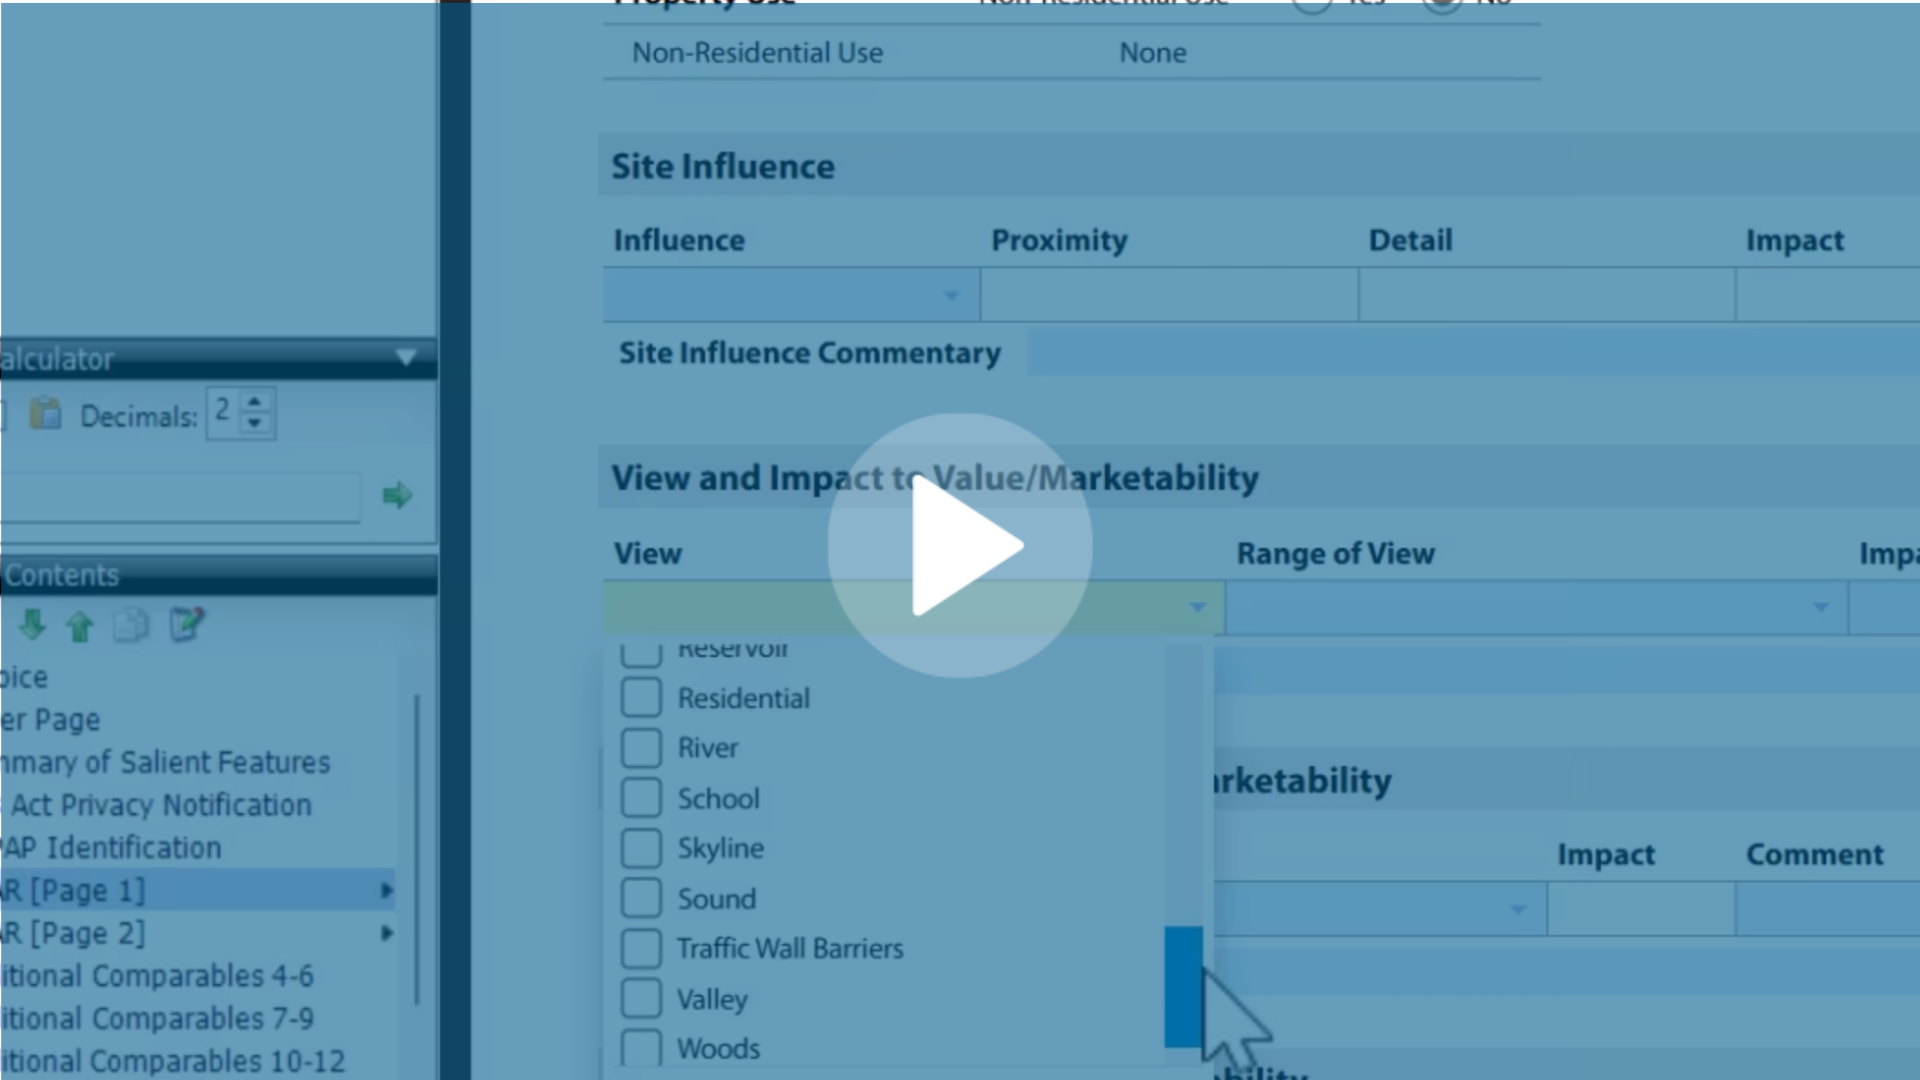
Watch the video to see it in action [1:49]

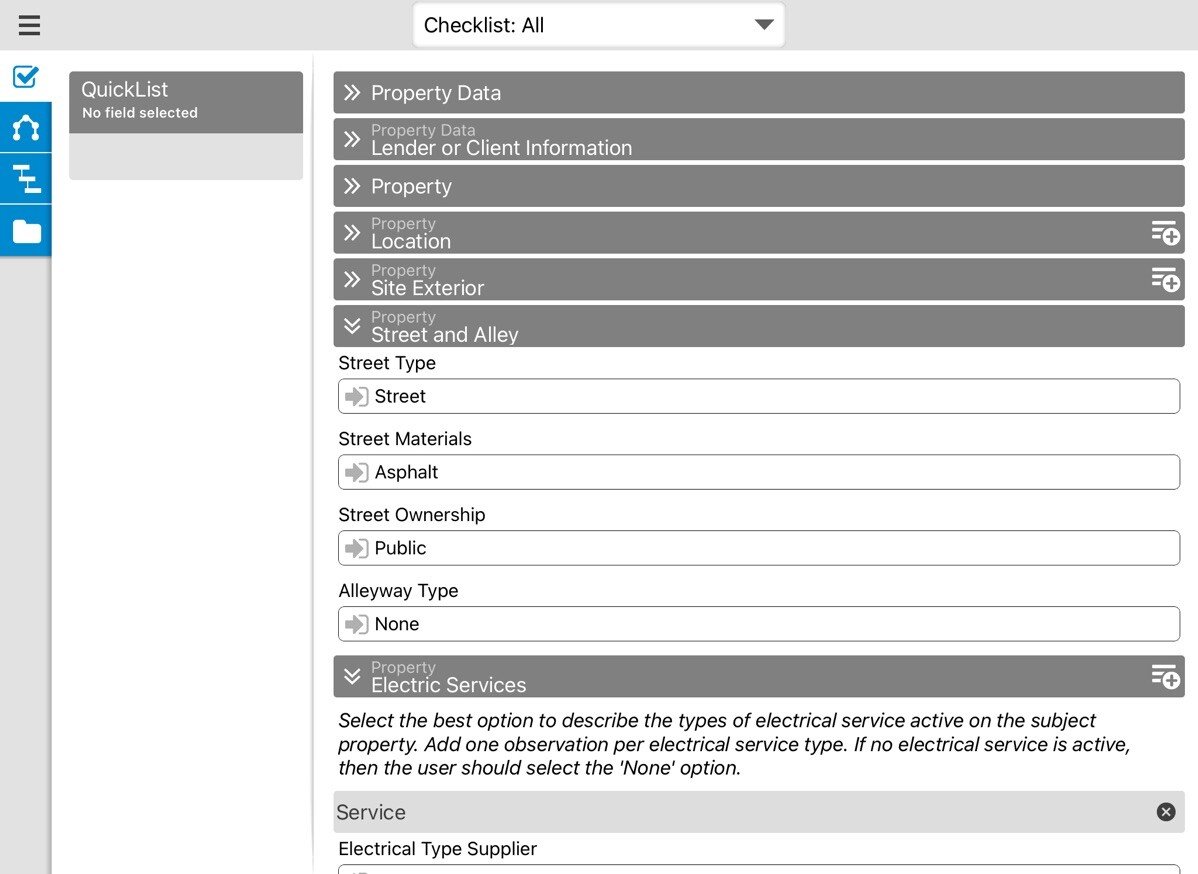
Import subject data
Use your MLS data to visually support comp adjustments and your opinion of value with new and improved graphs. To create a new graph from scratch, simply choose which data you want to represent in the X/Y-axis fields. These data points include:
Y-Axis
- Count of attributes
- Sales Price
- Sales Price / square foot
X‑Axis
- Age
- Bedrooms
- Below Grade Finished Area
- Garage Spaces
- Levels
- Sales Date
- Square Footage
- Total Baths
- Year Built

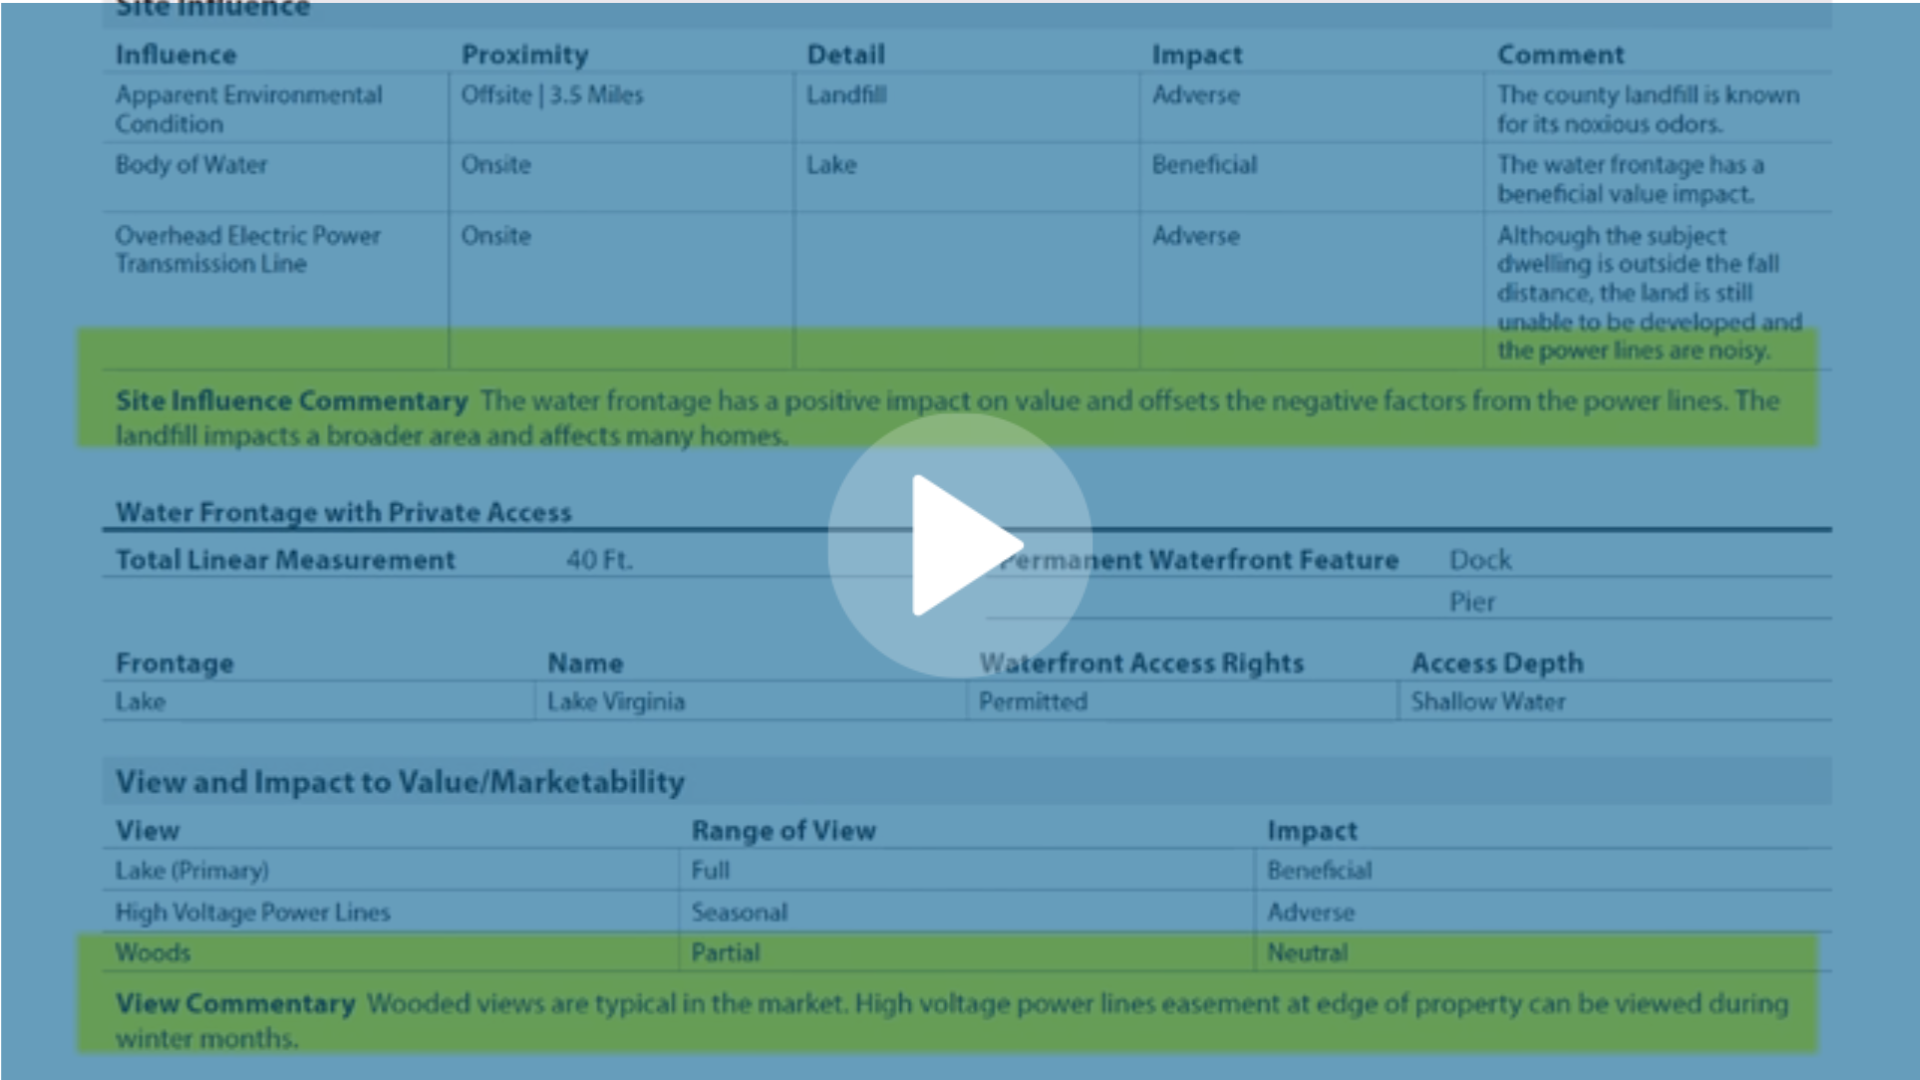
Addenda commentary
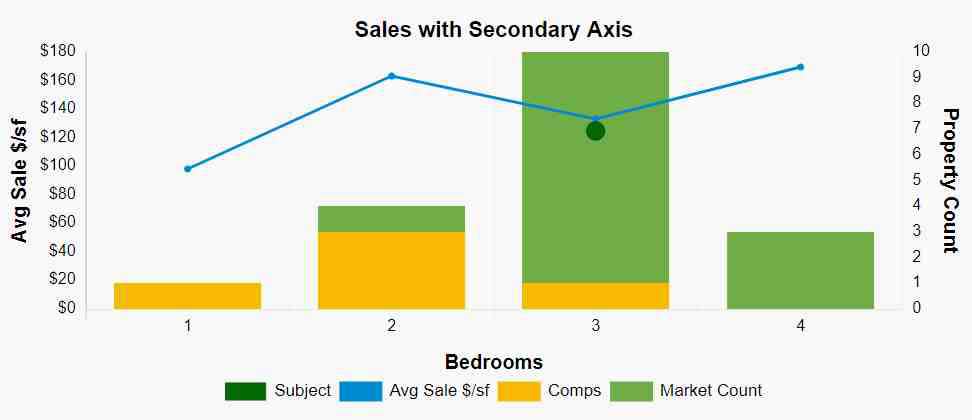
Example of addenda text: This chart shows the average sale $/sf for competing properties grouped by bedrooms with a secondary axis demonstrating the number of properties per group.
View market and subject data in one graph
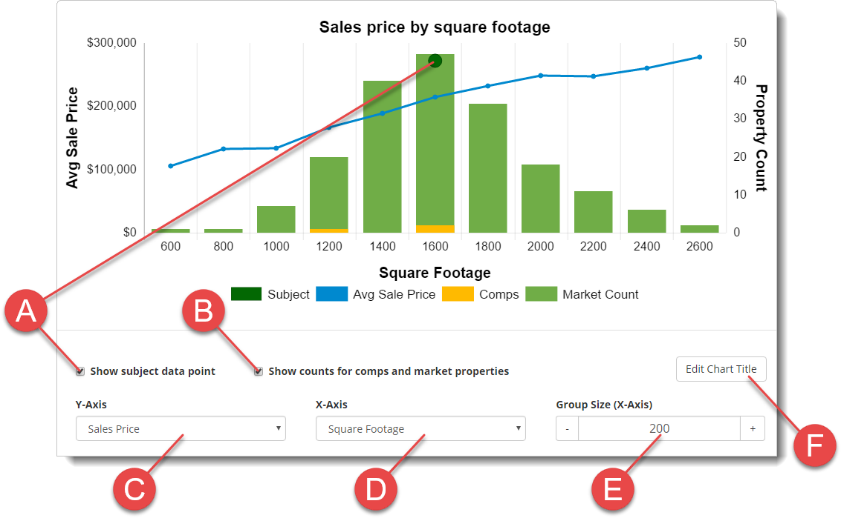
When creating a custom graph, or editing an existing one, in Titan Analytics, you can reflect your subject and comps in one place – a fast, easy way to display your regression analysis.
Simply check the “Show subject data point” and “Show counts for comps and market properties” boxes to display subjects and comps on the same graph. Your graph will also notify you of any restrictions (for example, when the data point doesn’t exist for either the subject or a comp in trending).
Haven’t finished your report and want to create a graph? No problem – you have the option to import your subject data from MLS by marking a row as the “Subject” in your MLS data. Titan Analytics will fill in any blank subject fields with data from the marked property, allowing graphing features without the need to import a completed report.
We’re always looking for your feedback so that we can deliver the exact tools you need to confidently start, support, and wrap-up your valuations. Sign in to Titan Analytics and give these new features a go. Then, let us know what you think. Here’s a step-by-step guide to creating custom graphs in Titan Analytics.
Don’t own Titan Analytics? Take $50 off now through June 30, 2020, and experience what an Elite Product Coaching Call is all about. For only $149, you’ll get Titan Analytics, plus, 45-minutes with a Product Coach to cover anything you’d like.
This offer is valid on new purchase only and can’t be combined with any other offers.
Elite members, don’t forget that your bundle includes the entire Titan suite, granting you immediate access to these new features.