| When deciding which comps to use in a report, or even which comps to put first, it’s often helpful to see them on a map, to visualize where each property is relative to the subject, each other, and where they are in the neighborhood. Use the comps side-by-side in TOTAL to generate a comp map on the fly. Learn more in this video. (1:08) |
Read On
UAD

Live Demo: Using TOTAL's Launch Edition on your first UAD 3.6 order
This month, we released our Launch Edition of TOTAL for our entire user base, who can now take UAD 3.6 orders and deliver them back to clients! As ...
UAD

TOTAL Completes UAD 3.6 Verification Process
Cotality | a la mode is excited to announce that we've completed the verification process with Fannie Mae and Freddie Mac for Uniform Appraisal ...
UAD
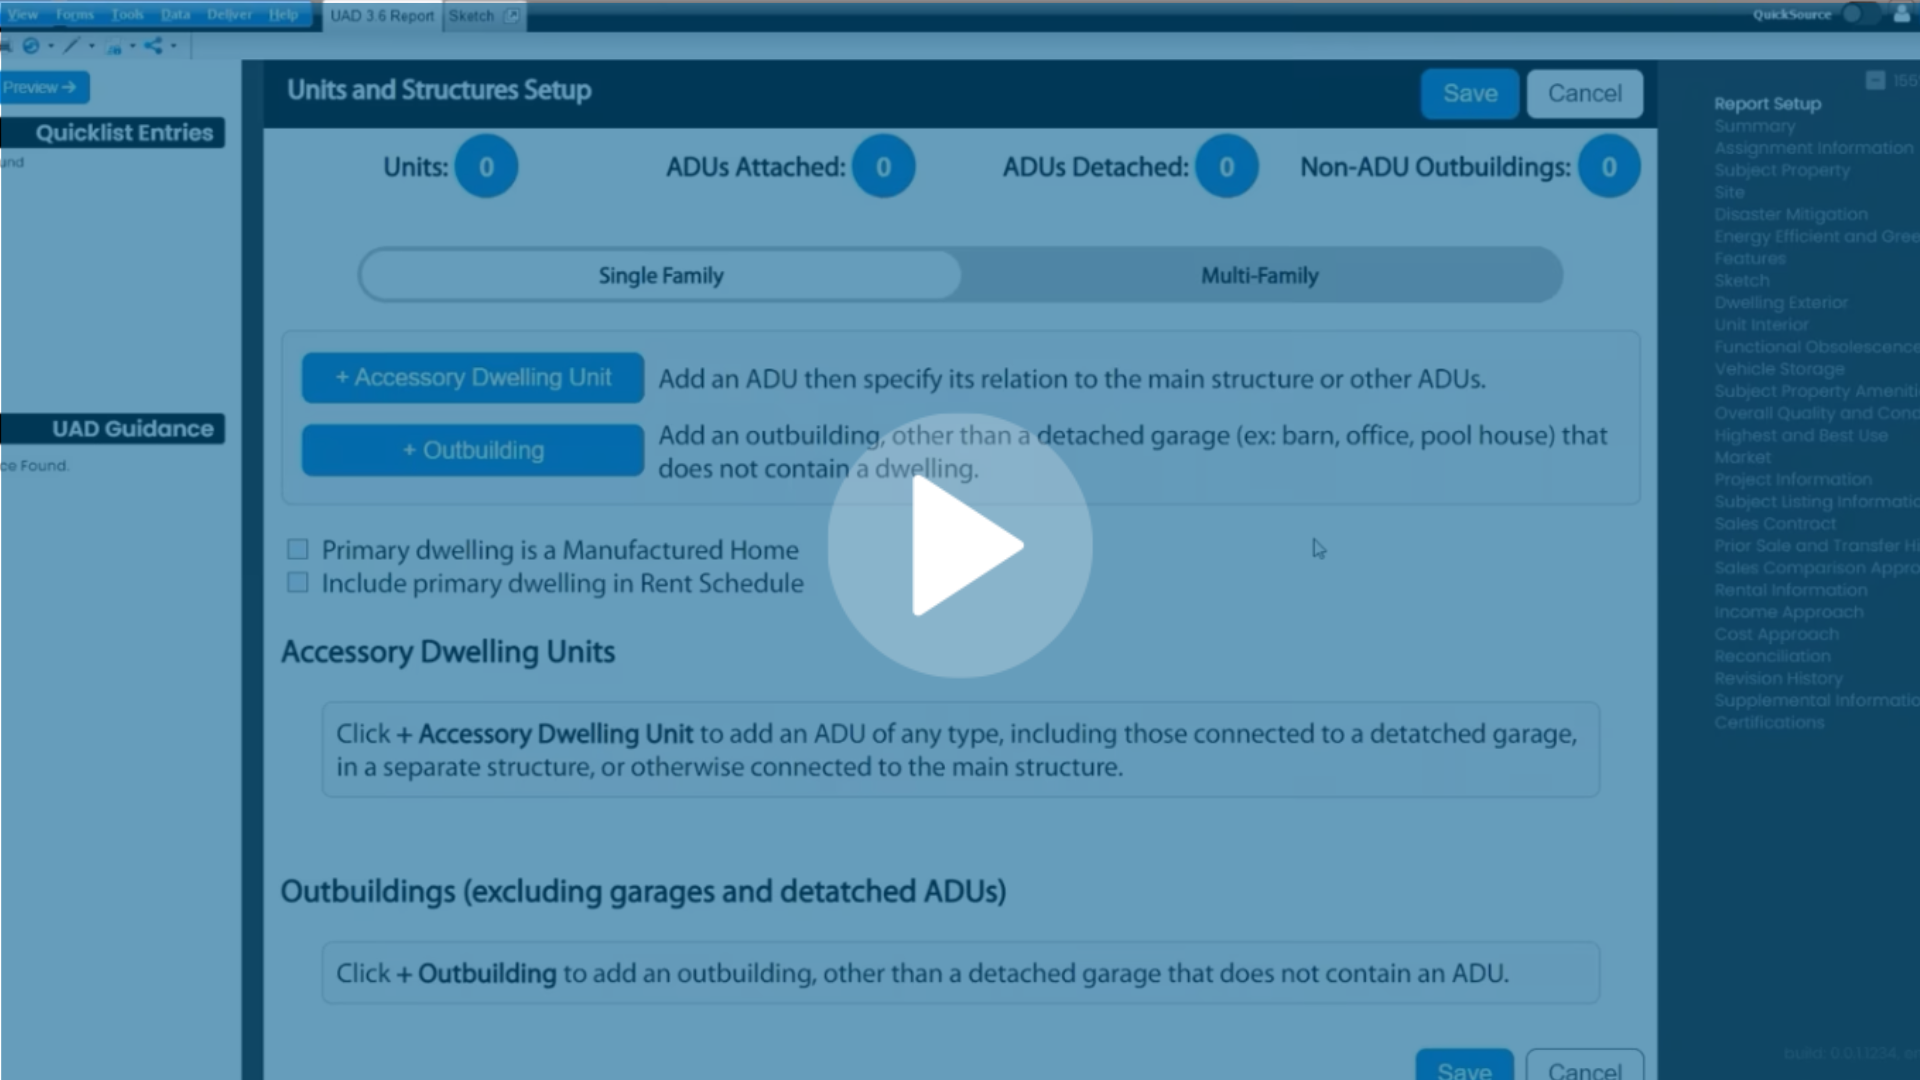
UAD 3.6 Focus: Adding ADUs
Adding an ADU in UAD 3.6 in TOTAL is easy with Report Setup, even with multiple entries! Hunter Farhat explains in this quick video. Want to know ...
UAD
.png)
Facebook Live: TOTAL's Learning Edition
In this Facebook Live event, Joel Baker explains what to expect from the "Learning Edition" of UAD 3.6 in TOTAL and how to best utilize it. He also ...
TOTAL for Mobile

Mobile Bootcamp: Day 1
Welcome to bootcamp! This video is the very beginning, the first of many to get you proficient in mobile appraising. This first session is designed ...
UAD
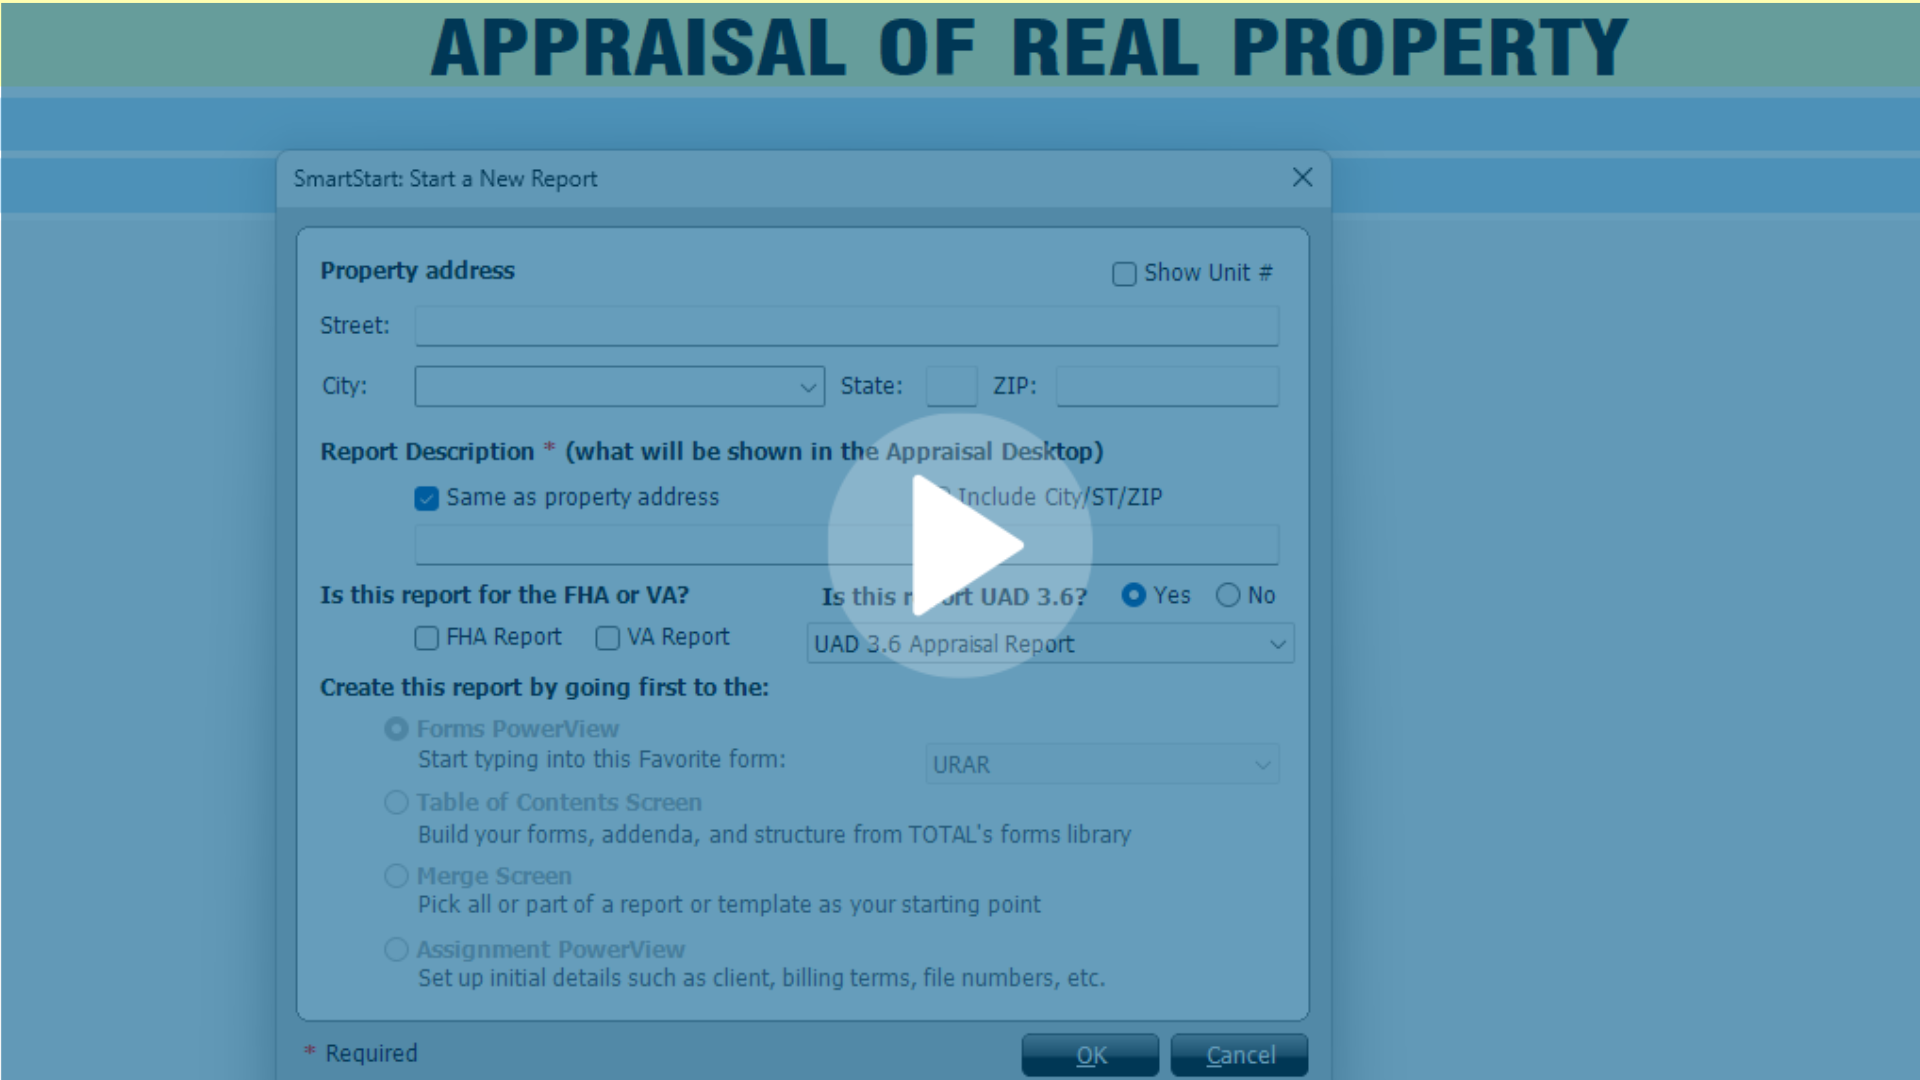
UAD 3.6 Focus: Getting Started in TOTAL
Since the new URAR isn’t a form, you won’t find it in TOTAL’s list of forms. Watch this short video to see how to launch a new UAD 3.6 URAR in TOTAL. ...
UAD

UAD 3.6 in action: Mobile Demo
You may have heard that "going mobile" will be important for UAD 3.6, but do you know why? The short answer is: a much larger dataset and fields that ...
UAD
.png)
UAD 3.6 In Action: A live Demo with Joel Baker.
We have been preparing for UAD 3.6 for years, and it goes well beyond just expanding the number of fields. We’ve been working on several products ...
UAD
-1.png)
Preparing for UAD 3.6: A conversation with Cotality and Freddie Mac
Freddie Mac's Scott Reuter and Sean Murphy sit down with Cotality's Joel Baker and Shawn Telford to offer up key insights into coming UAD changes. ...
UAD
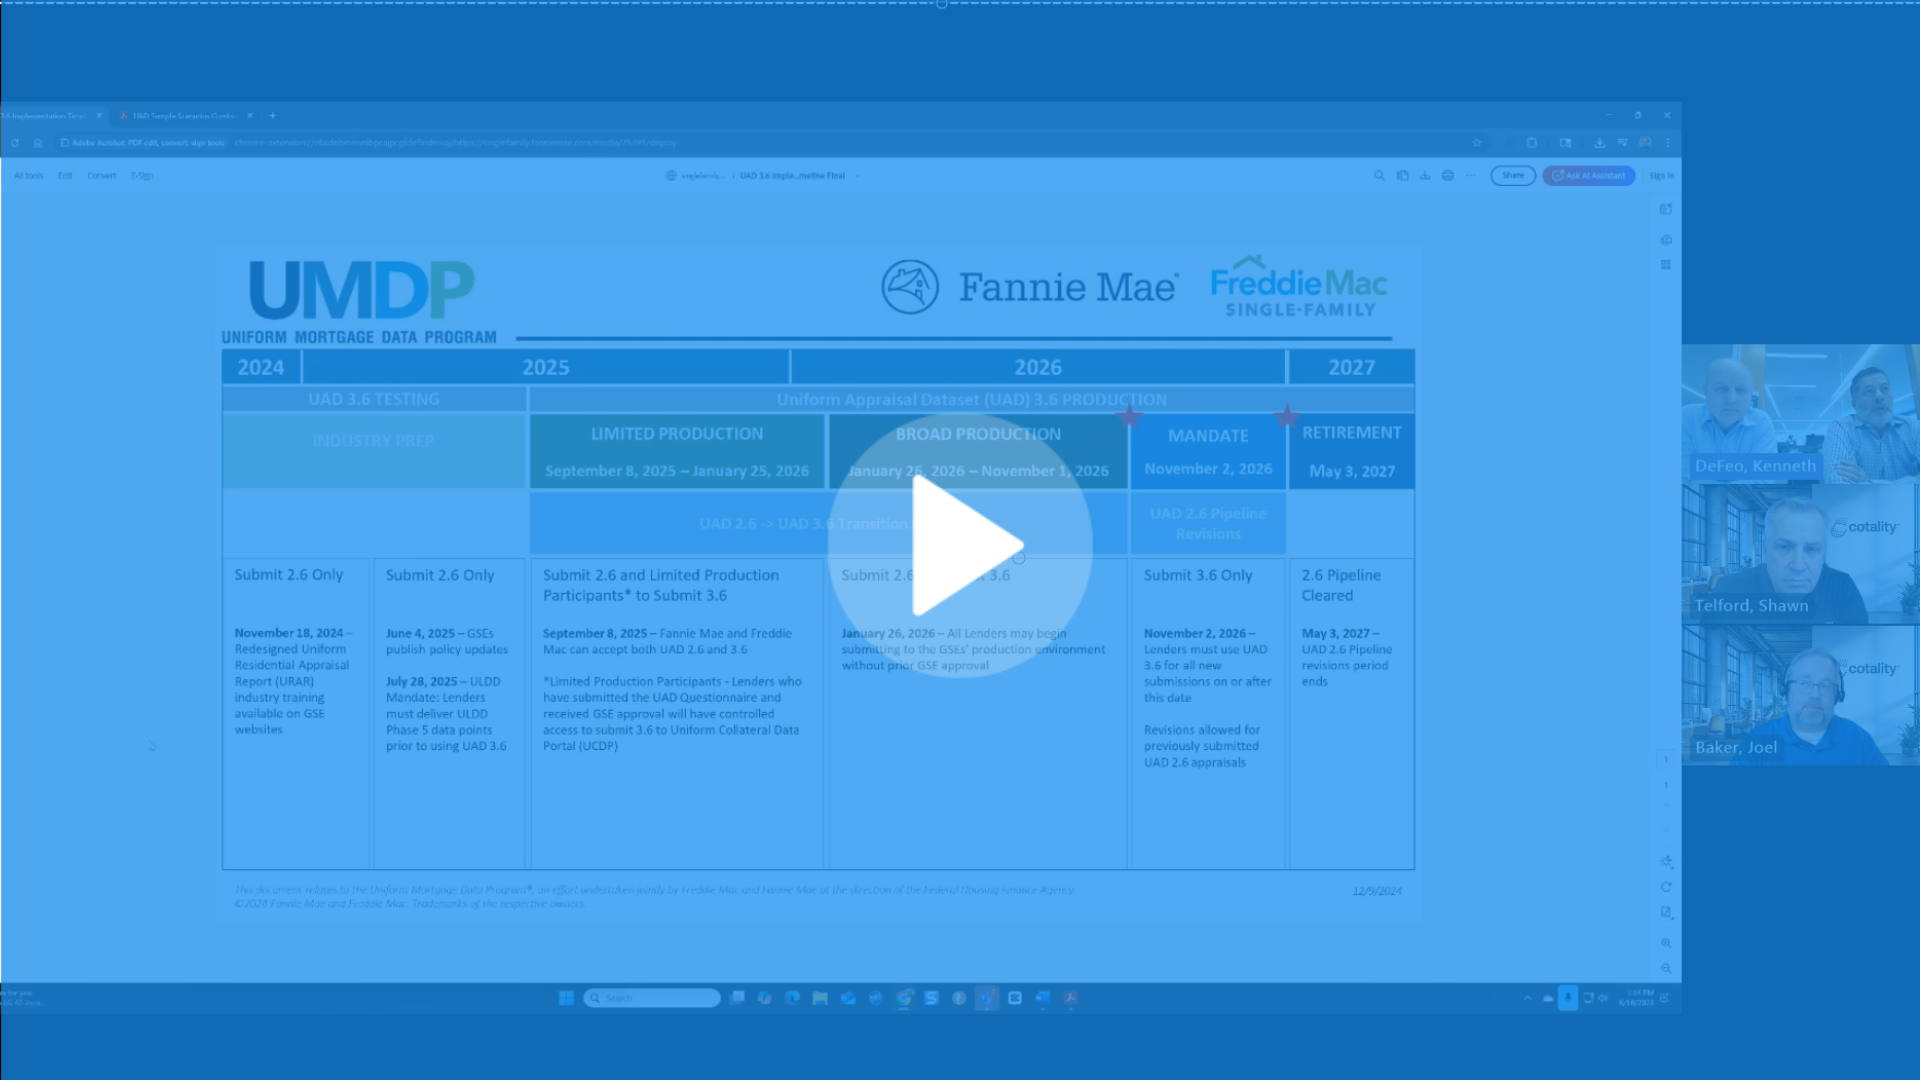
UAD 3.6 Focus: Limited Production
Limited Production of the new URAR starts two months from today! In this clip from our recent interview with FNMA, Ken DeFeo and Lyle Radke talk ...
UAD
-1.png)
Preparing for UAD 3.6: A conversation with Cotality and Fannie Mae
Check out our most recent info-packed webinar featuring Fannie Mae's Lyle Radke and Ken DeFeo. We discuss upcoming changes to UAD and how to prepare! ...
UAD
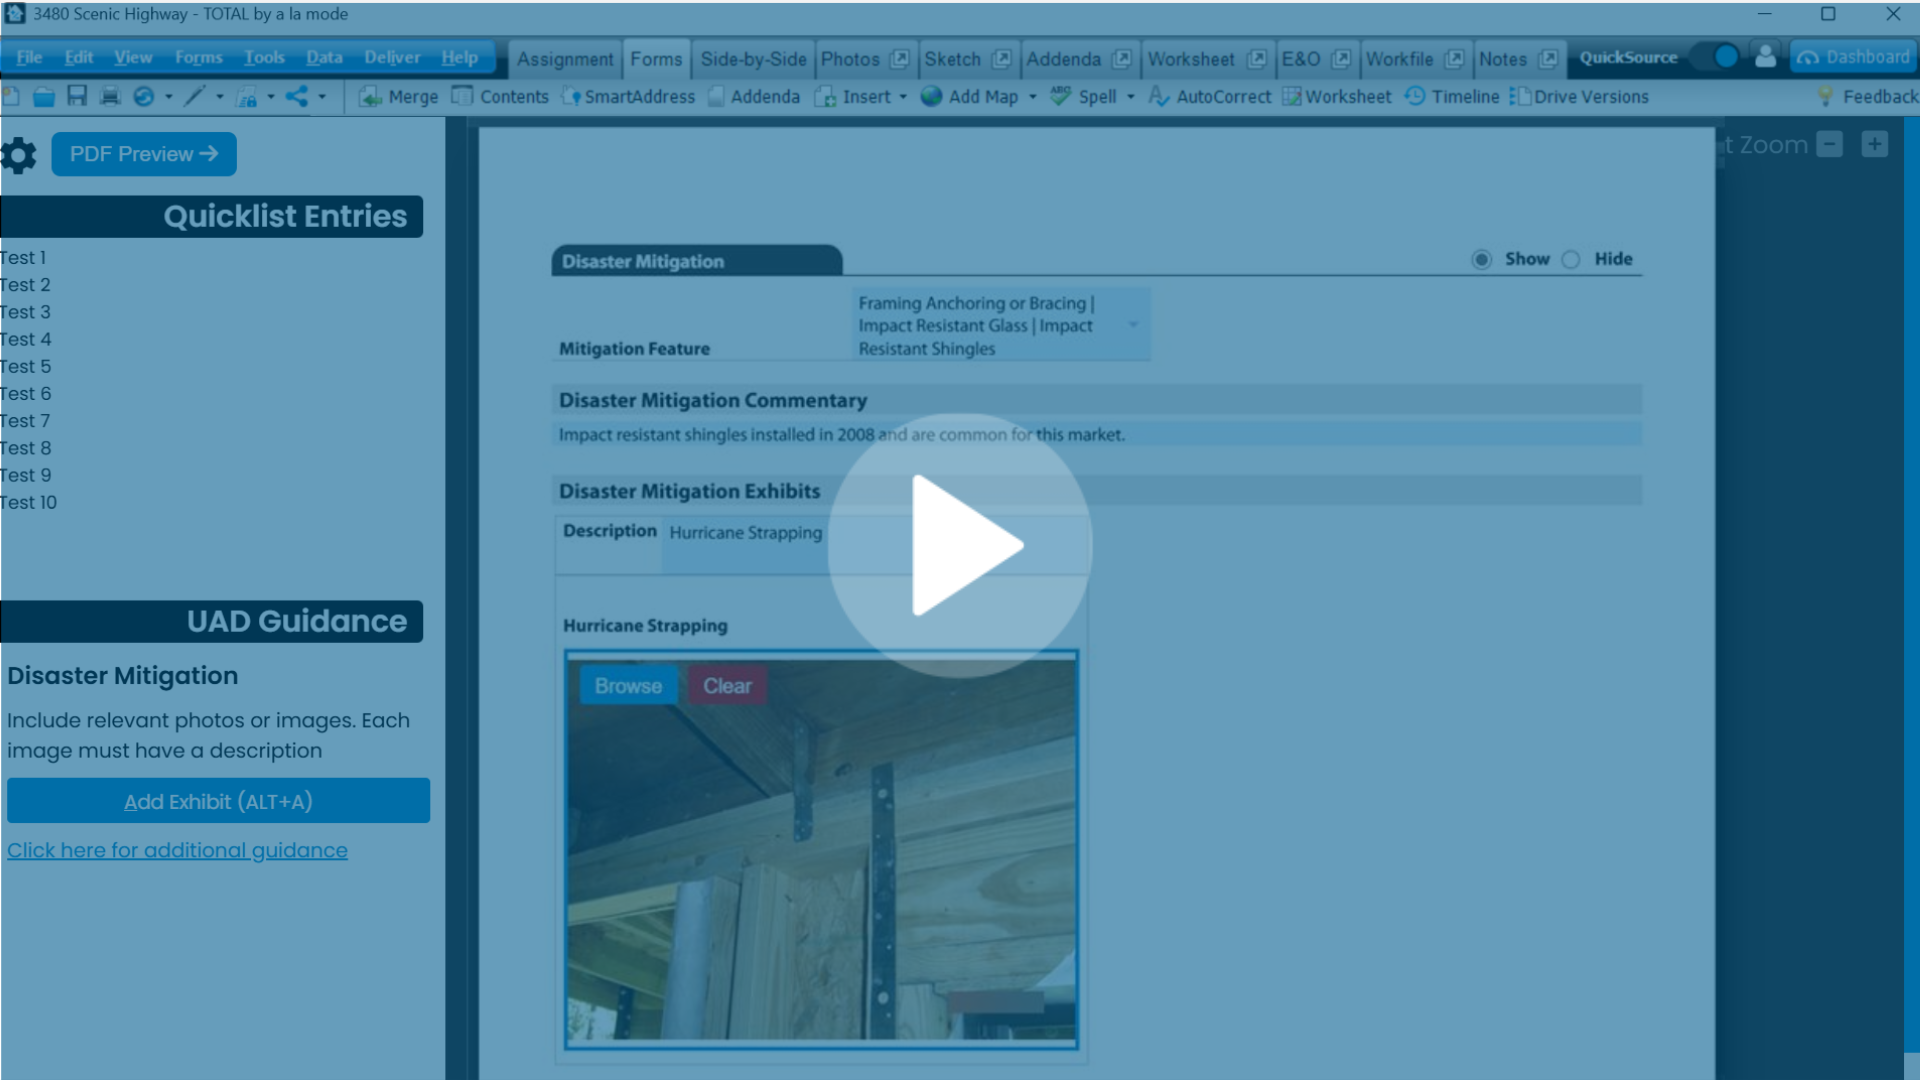
UAD 3.6 Focus: Disaster Mitigation Part 2
If you’re including the disaster mitigation section in the new URAR, the commentary field is a required field. You'll want to set up some new ...
Podcast
.png)
Appraisal Buzz Podcast- Preparing For The New URAR
Hal Humphries invited me onto his podcast Appraisal Buzz to talk about the impending UAD storm, and why appraisers who are using 19th century ...
UAD
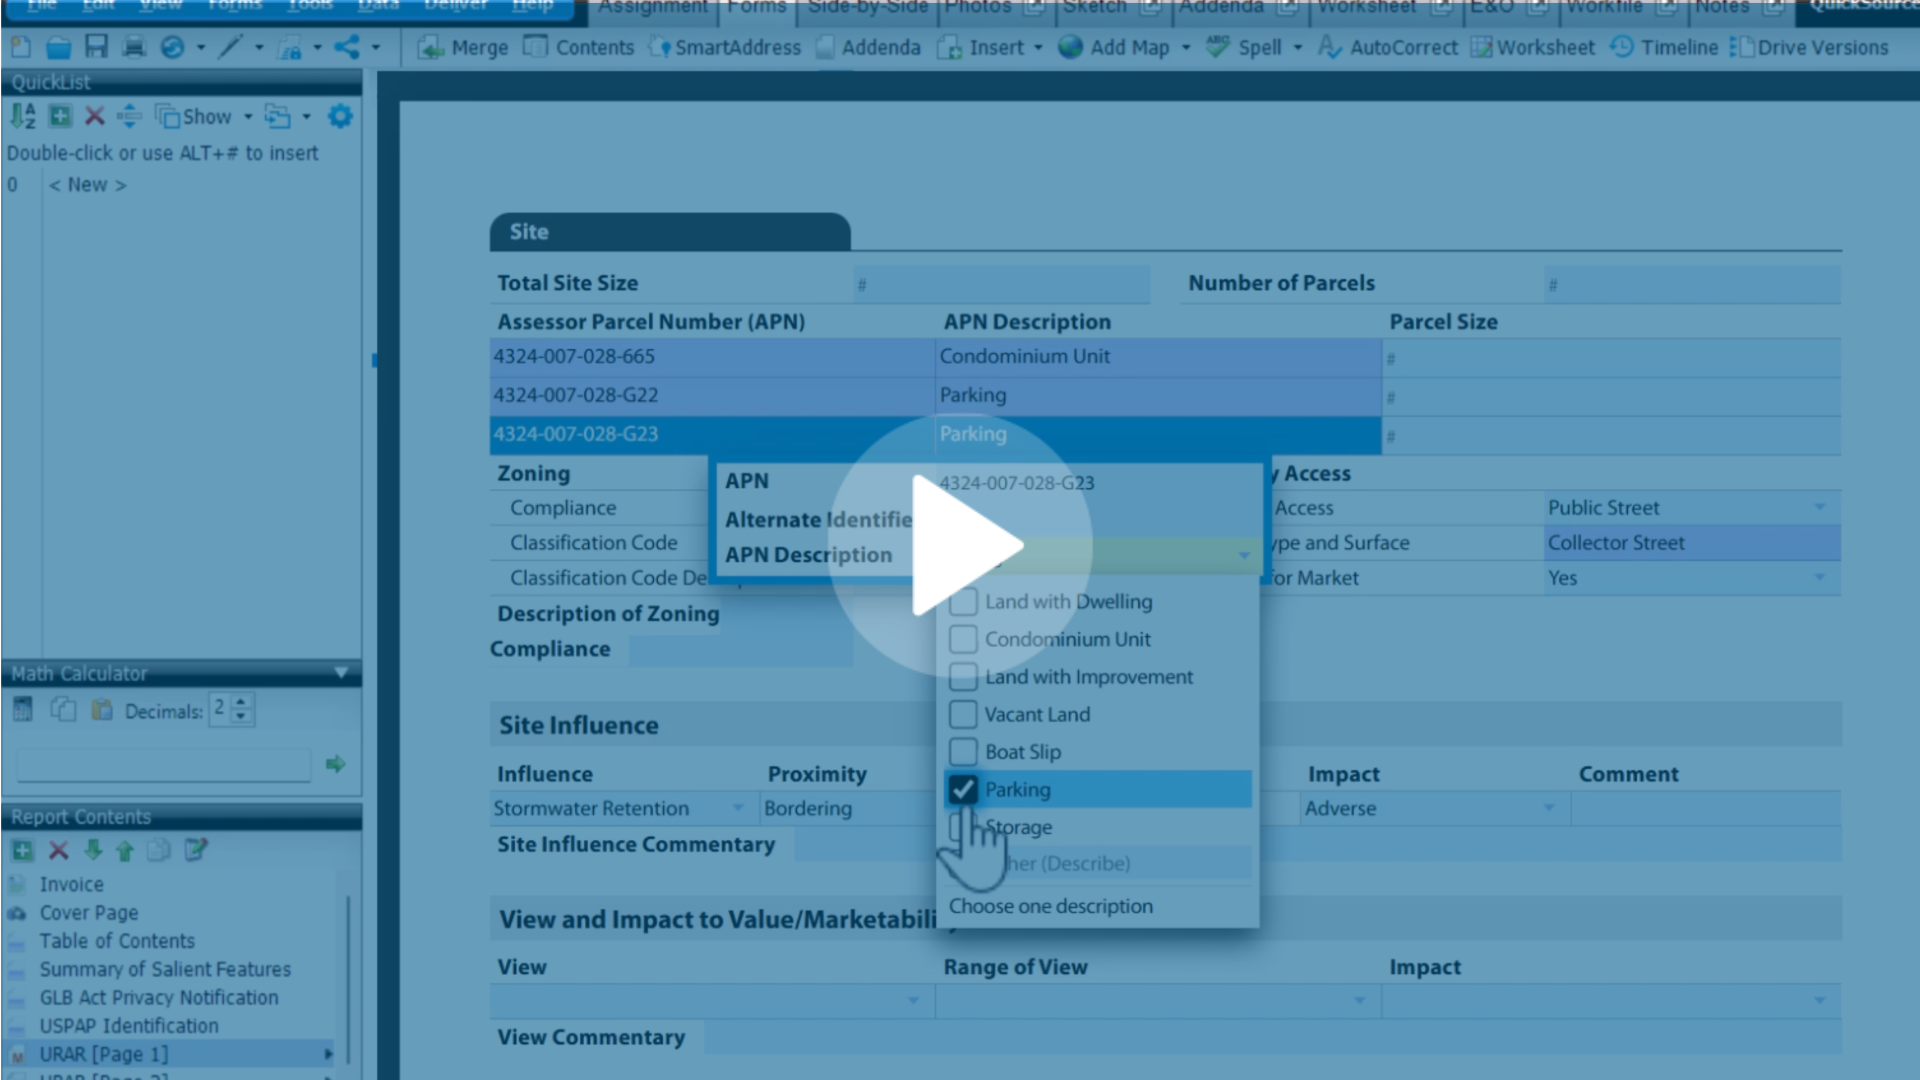
UAD 3.6 Focus: Disaster Mitigation
The new URAR has a section for Disaster mitigation features for your subject property, and it consists of three pieces. Watch this video to see the ...
UAD
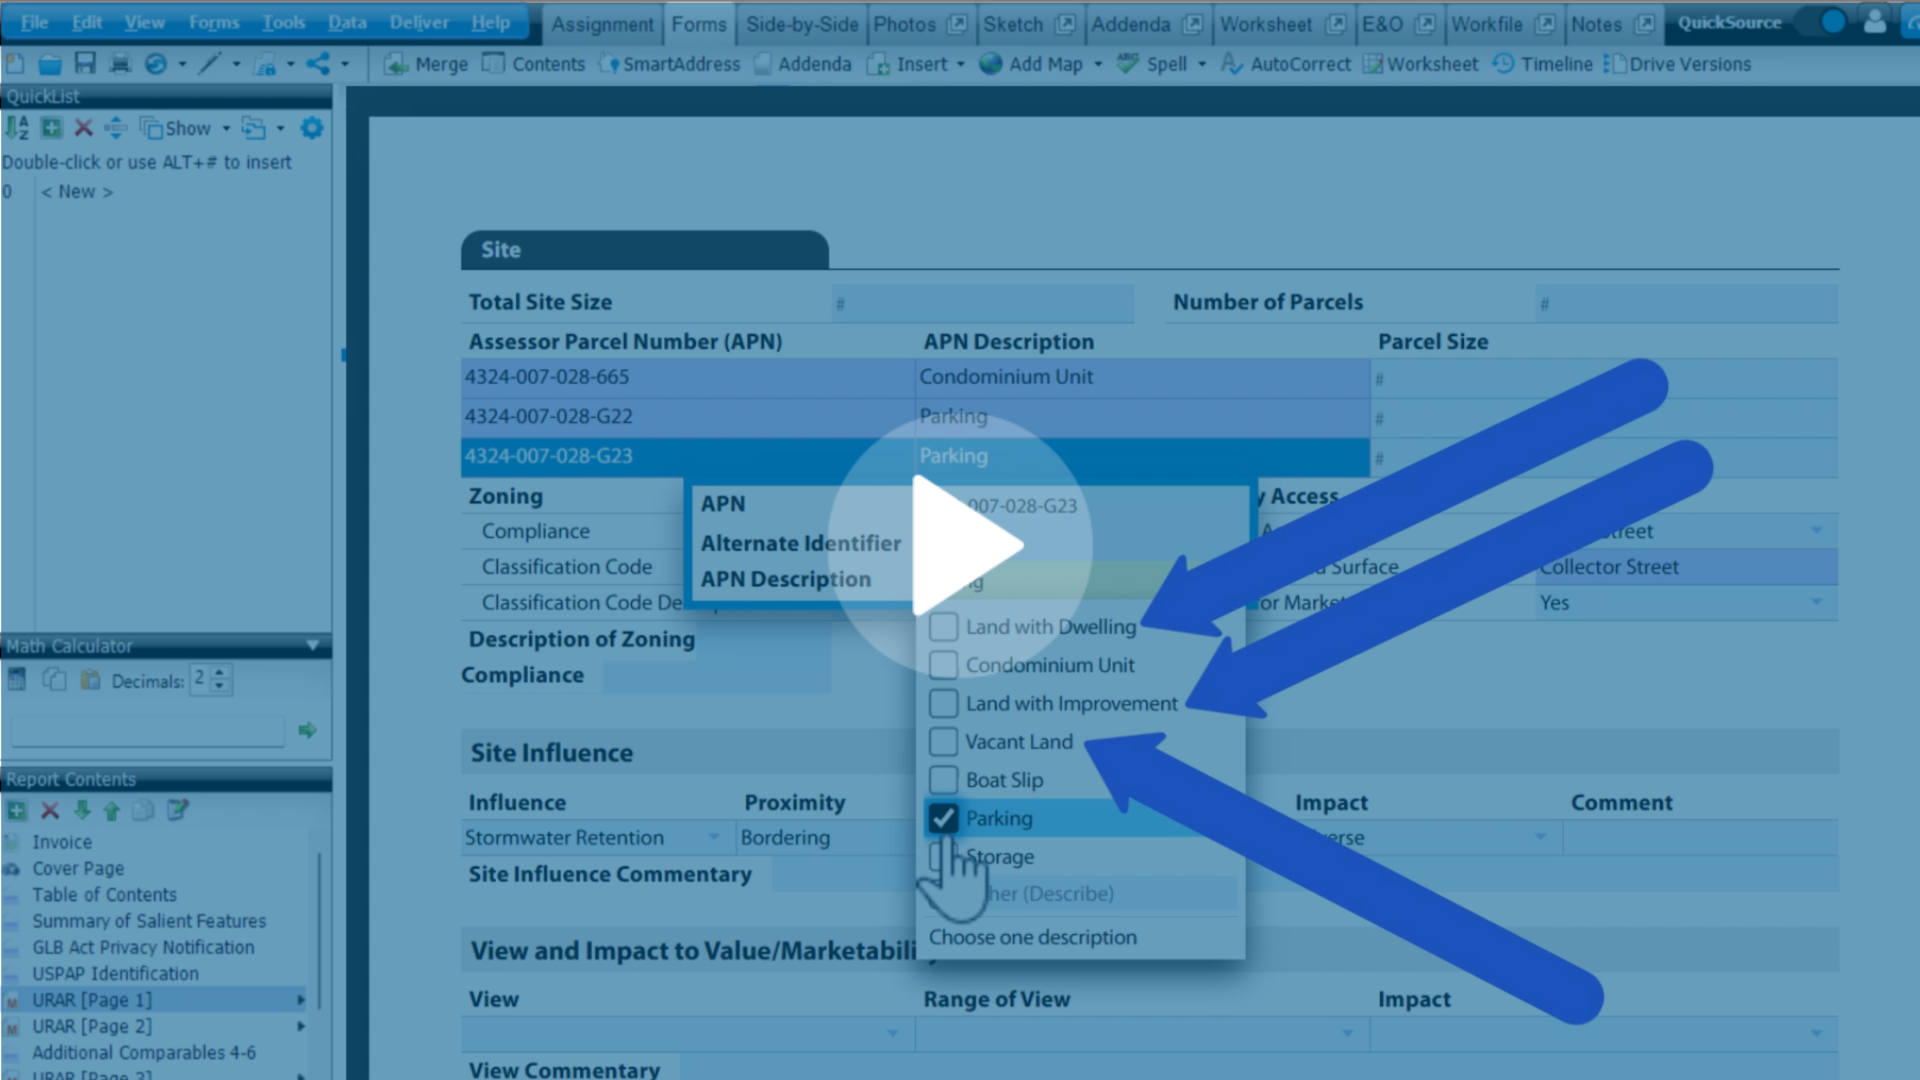
UAD 3.6 Focus: APN Size
If you're not planning to use TOTAL for Mobile on your inspections with the new UAD, you will need to be intimately familiar with Appendix F-1. Watch ...
Review
.png)
Appraisal-based loan defects and "findings": Shawn and Joel talk Fannie's recent Quality Insider
Quality Insider is a series from Fannie Mae that focuses on tips and best practices for lenders and appraisers. The article discussed in today's ...
UAD

UAD 3.6 Focus: Multiple APNs and Tables
Itemization in tables – of many things that used to be free-form commentary, is a common theme in the new UAD. Watch this short video to see what ...
Appraiser
.png)
Your clients are judging you. How to get ahead of the grading curve today.
The appraisal industry has changed a lot in the last 30 years. Today, lenders may have as much information about the market, property, and ...
UAD
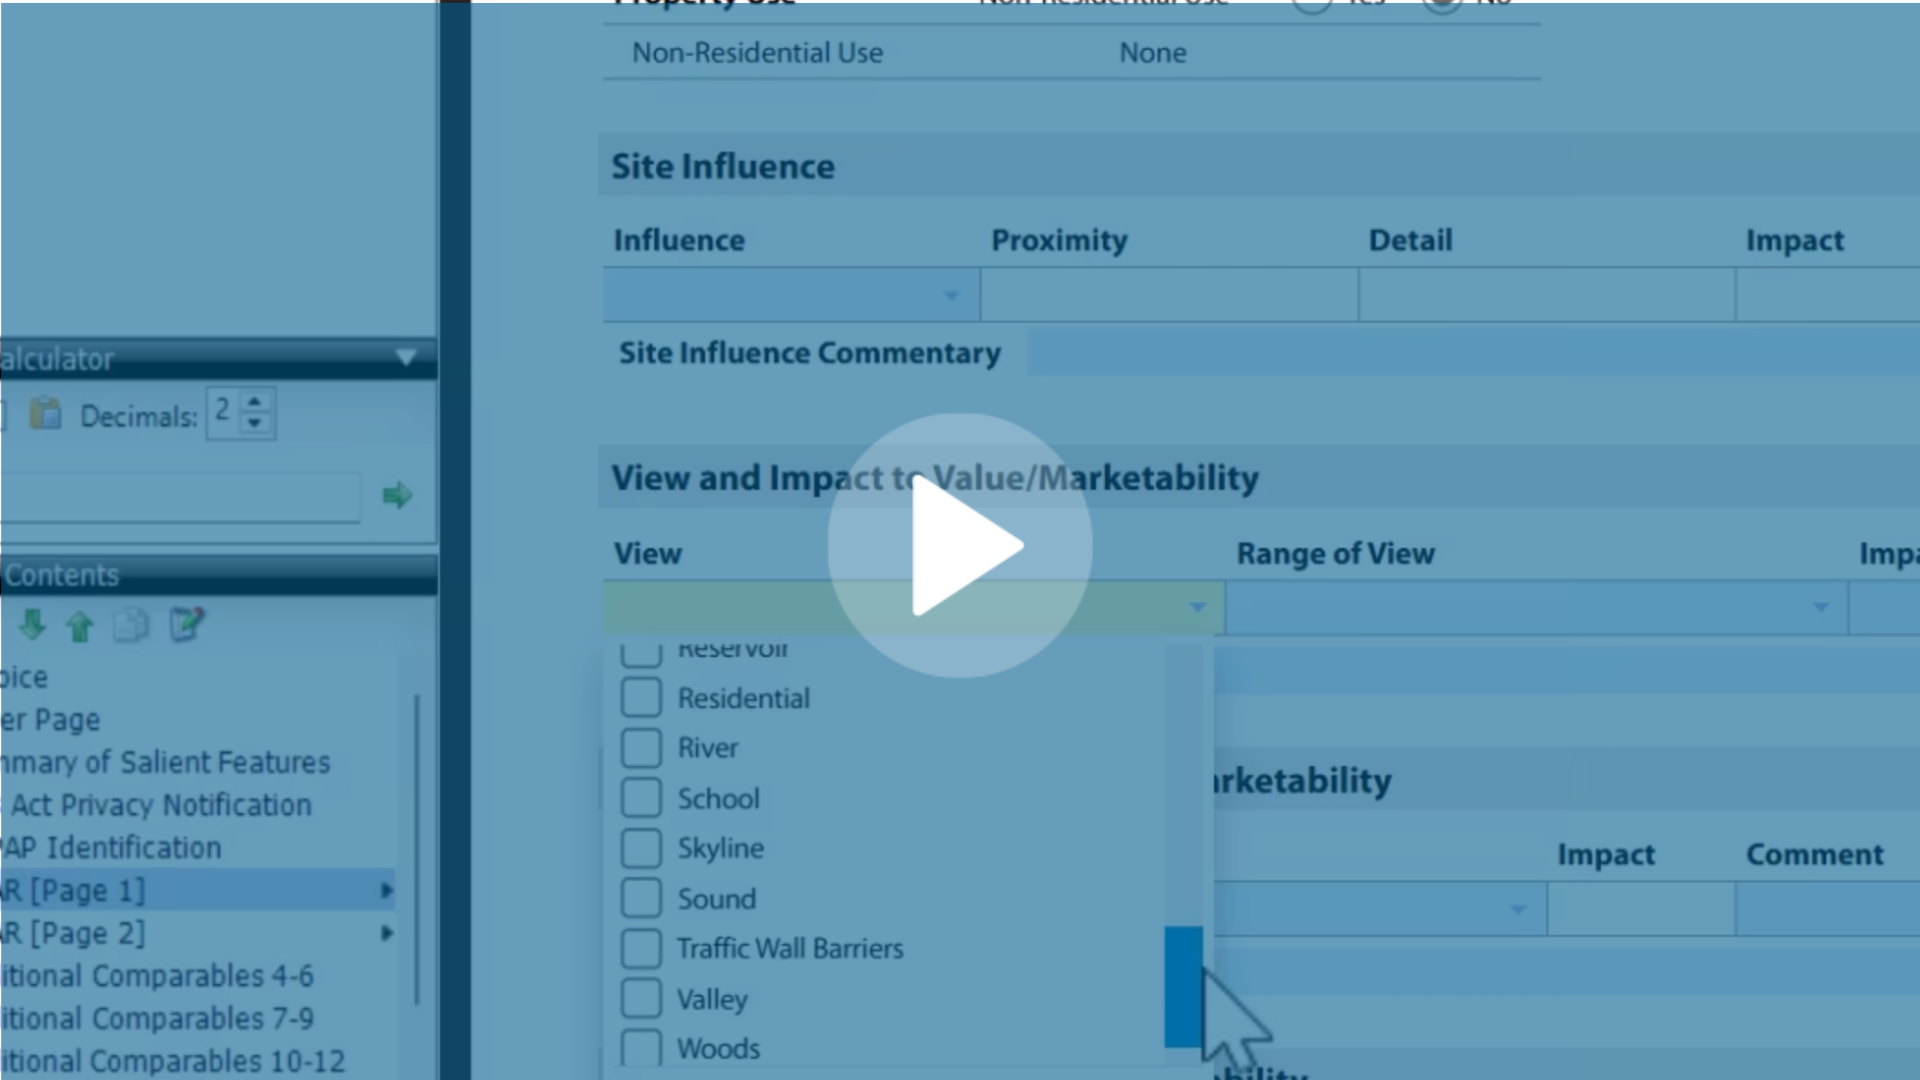
UAD 3.6 Focus: Site View Expansion
In the new UAD, the provided list for Site View is much larger, and there are no abbreviations. You also must specify the range of the view. Watch ...
TOTAL for Mobile
.jpg)
ACTS 2025 Recap: The Future of Appraisal
We had an incredible time at the 2025 Appraisers Conference and Trade Show (ACTS) in San Antonio, TX! We’re still buzzing with excitement from a few ...
New UAD
.png)
From UAD to Market Analysis: Shawn and Joel discuss new Freddie and Fannie items
Appraisers have long been expected to provide support for their results. So what's different today? In this 17 minute conversation Joel and Shawn ...
UAD
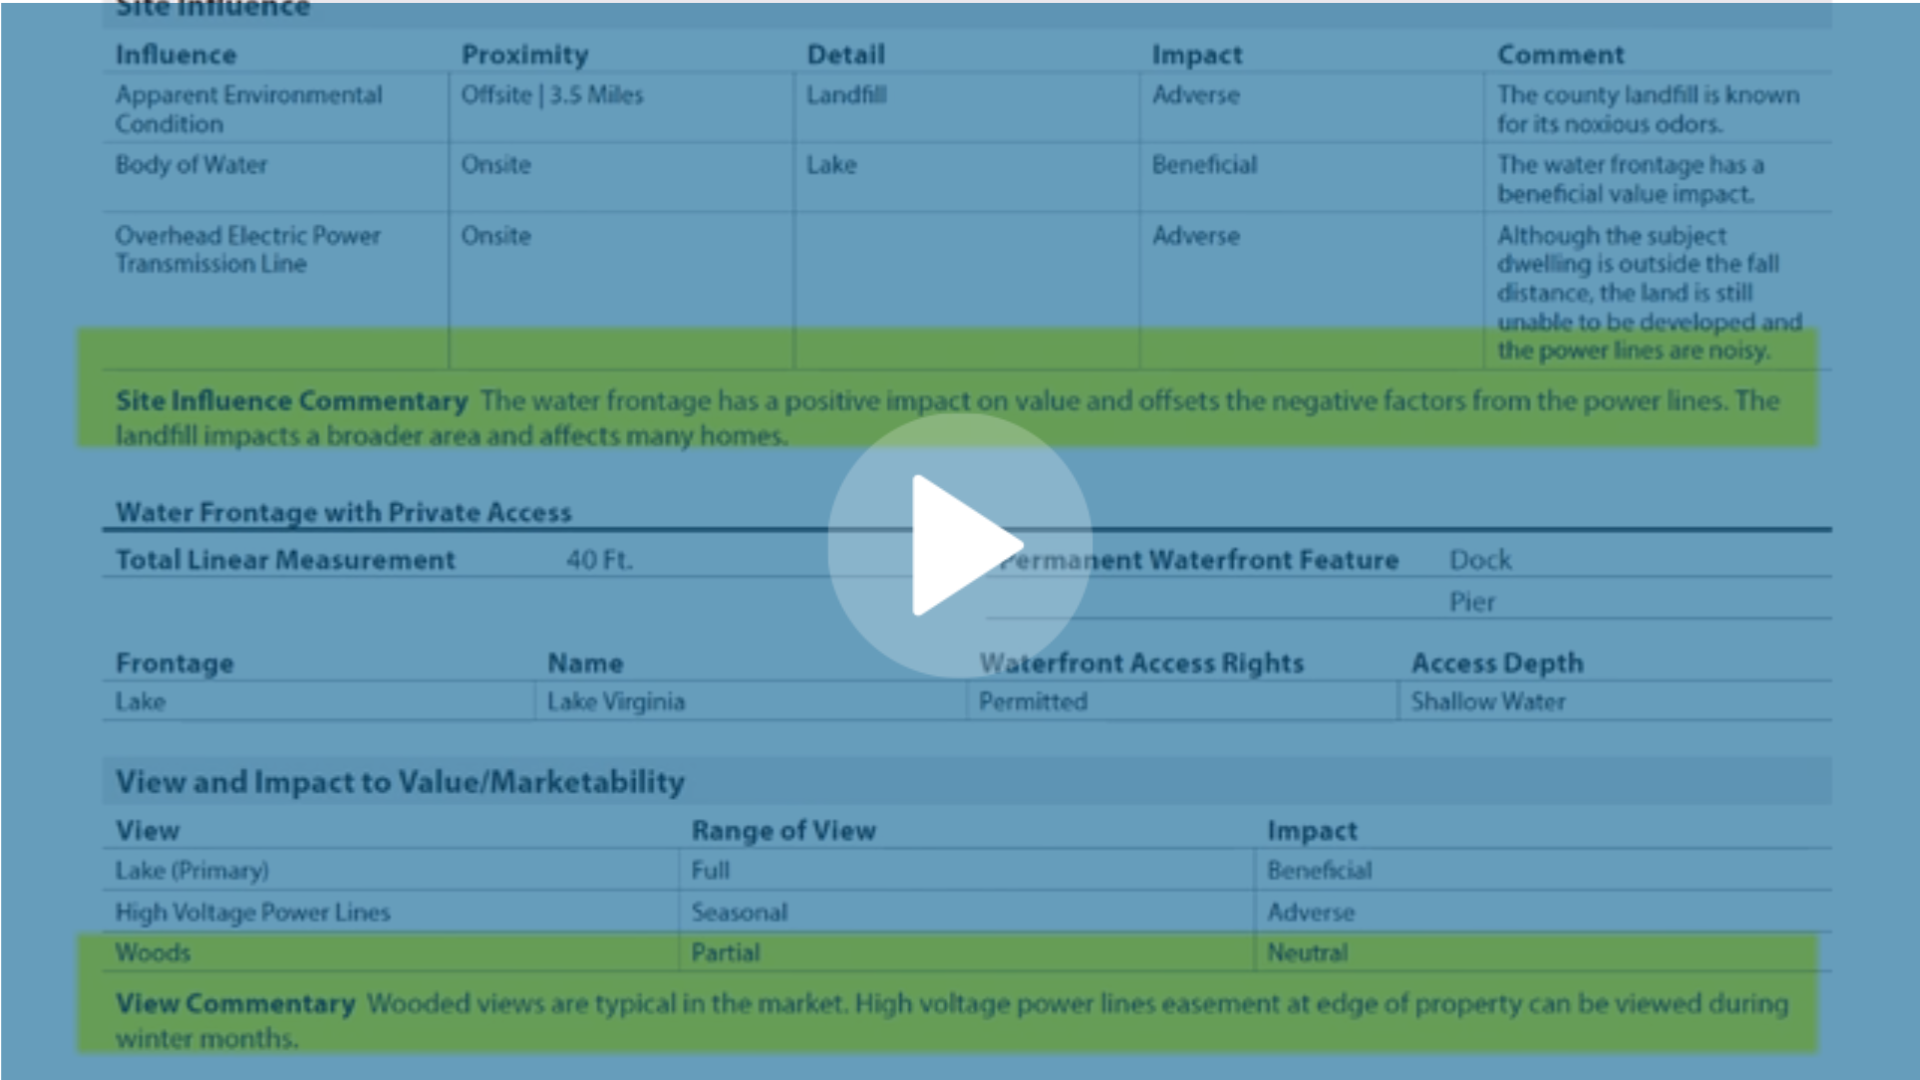
UAD 3.6 Focus: Site Commentary Examples
Note that this property has 2 parcels, but there’s no subsection comment dedicated to it. At the end of the Site section is where you put any ...
UAD
-1.png)
TOTAL for Mobile - The Upgrade You Already Own
If you’ve ever had to return to a property because you missed something important, you know it’s not ideal. It can be frustrating, time consuming, ...
UAD

UAD 3.6 Focus: Tips from ACTS
I was asked a LOT at ACTS this year about whether learning "mobile" now will be applicable to the new UAD 3.6, and the answer is YES, and especially ...
UAD
UAD 3.6 Focus: Broadband (Site Section Part 2)
When is "Broadband Internet" not broadband internet? See what the GSEs want in the new URAR in this quick video. Have a suggestion for a Tech Tip or ...
UAD
UAD 3.6 Focus: Site with Waterfront Part 1
Going through the dataset for UAD 3.6, appraisers will likely notice the Site section is significantly enhanced, and many inspection items that used ...
UAD
UAD 3.6 Focus: Excluding Approaches to Value
The GSEs have a field dedicated to describing WHY you didn't use an approach to value. Watch this short video to see one of their examples. Have a ...
UAD
UAD 3.6 Focus: New Construction, New Definition
The GSEs have clarified the definition of what constitutes a "new construction" property. Watch this short video to see the updates for the new UAD ...
UAD
UAD 3.6 Focus: Pop Quiz #2
The new UAD is on its way. Test your knowledge about the basics with this short, three-question "Pop Quiz" video. Have a suggestion for a Tech Tip or ...
UAD
UAD 3.6 Focus: Comp Weighting Part 3
The new UAD has a surprising number of new requirements, many of which aren’t listed directly on the text of the report. An example of this is ...
UAD
UAD 3.6 Focus: Comp Weighting Part 2
Today, we’ll look at some examples the GSEs have given for describing relative comp weight. Watch this short video to see what it looks like. Have a ...
UAD
UAD 3.6 Focus: Comp Weighting Part 1
In the new UAD, the GSEs are requiring the appraiser to identify how they’ve weighted each comparable – right in the grid. Watch this video to see ...
Tech Tips
Tech Tip: Fannie and Freddie Market Analysis in TOTAL using Titan Analytics
Today's tech tip is significantly longer than usual. I show how to input your comp-specific market analysis into TOTAL, and also how to use Titan ...
UAD
UAD 3.6 Focus: A Conversation with Fannie Mae and CoreLogic
Kenneth DeFeo from Fannie Mae explains how the new dataset and report structure is designed to be more flexible and future-proof the appraisal ...
New UAD

The Future of UAD: A Conversation with Fannie Mae
Check out the Future of UAD webinar recording with Joel Baker and Shawn Telford as they chat with Fannie Mae's Lyle Radke and Ken DeFeo as they ...
UAD

What We Know About UAD 3.6
Maybe you’ve heard about the UAD changes, or maybe you’ve been trying not to think about it. Either way, a la mode is here to help you stay updated, ...
UAD
UAD 3.6 Focus: Expanded Highest and Best Use
The Highest and Best Use in the new URAR now always requires a yes/no answer to each of the 4 tests for highest and best use. Watch this short video ...
UAD
UAD 3.6 Focus: Prior Service Certifications
If you have performed prior service, the certification changes to say so, and you’re given a box to summarize that service within the certification. ...
UAD
UAD 3.6 Focus: Pop Quiz #1
The new UAD is on its way. Test your knowledge about the basics with this short, three-question "Pop Quiz" video. Have a suggestion for a Tech Tip or ...
UAD
UAD 3.6 Focus: Exterior inspection as a comp data source?
Did you drive the comps? The new URAR has a spot in the Data Sources for that. Watch this quick video to see what that looks like in the new UAD. ...
Tech Tip
UAD 3.6 Focus: No more free-form data sources
Data Source fields in the new URAR require picking from a list, and some of these you’ve likely not specified in the forms previously. Check out the ...
UAD
The Future of UAD: Freddie Mac Recording Q&A
Q&A Blog: Freddie Mac Session Follow-Up with Joel Baker
Tech Tip
UAD 3.6 Focus: Freddie Mac talks about “Properties Analyzed But Not Used”
This week’s tip is courtesy of Sean Murphy from Freddie Mac, who discusses the use of the new UAD’s section for “comps considered” – the Properties ...
Tech Tip
UAD 3.6 Focus: No more “Verification Source” in the URAR
The new URAR doesn’t have a spot for verification sources. See how your data sources will work in the new UAD reports. Have a suggestion for a Tech ...
Tech Tip
UAD 3.6 Focus: No More Effective Age
With the new URAR, the GSEs are only interested in Year Built for the subject. Effective Age can still show up in a couple of places, but only ...
New Product Coach Alert!
One thing every a la mode customer loves is a helpful 1-on-1 product coaching session that helps them get more out of their products and features.
Tech Tip
UAD 3.6 Focus: UAD’s new dynamic certifications
The old 1004D certifications are still in the new URAR, but the new UAD reporting formats have some shared dynamic certifications. Let’s take a look. ...
Tech Tip
UAD 3.6 Focus: Two new URAR inspection requirements
The new URAR has a few new required items you’ll have to get on an inspection. Watch this short video to see a couple of the new required items. Have ...
Tech Tip
UAD 3.6 Focus: New Appraisal Update Report
This week, we’ll look at the new Appraisal Update report format. It’s remarkably similar in data and function to the 1004D that it’s replacing. Watch ...
News
UAD 3.6: An interview with Matt Krodel
As we get closer to the limited release of the new UAD, a la mode is here to keep you informed on the changes you can expect to see in TOTAL. Check ...
Tech Tip
UAD 3.6 Focus: Completion Report
The 1004D is being replaced with two new report formats. Check out the new Completion Report sample files! You can check out the Fannie Mae UAD ...
Tech Tip
UAD 3.6 Focus: New example files
Just landed! The GSEs have released some new and updated sample reports for the new URAR with the upcoming UAD dataset. Watch this quick video (1:56) ...
Tech Tip
UAD 3.6 Focus: Comps considered, but not used
The new UAD has a specific spot in the report for you as the appraiser to communicate, in advance if you want, similar properties that you considered ...
Tech Tip
UAD 3.6 Focus: Adverse site conditions – “busy road”
The upcoming new UAD has a few changes, and an expanded Site section is certainly one you’ll want to pay attention to. In this specific example, we ...
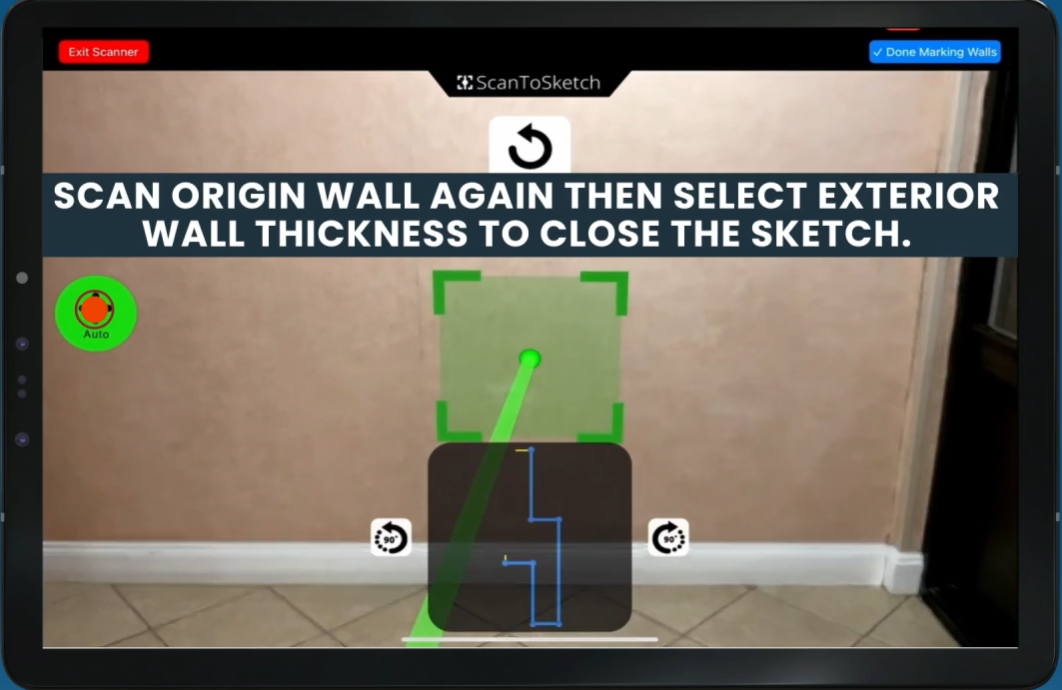
ScanToSketch: Revolutionizing interior sketching
With ScanToSketch, you can create interior footprint sketches in minutes. This cutting-edge feature of our TOTAL for Mobile app allows you to mark ...
Tech Tip
UAD 3.6 Focus: Which forms are being replaced?
The new URAR is slated to replace more than a dozen of the most-used GSE forms with a single, dynamic report. This includes the 1004, 2055, the Condo ...
Tech Tip
Tech Tip: Drag-and-drop your comps into place
Rearranging comps in TOTAL is literally a drag-and-drop process. Watch this short video to see how. Have a suggestion for a Tech Tip or comment on ...
Tech Tip
Tech Tip: Hiding comps temporarily
With TOTAL you can click the black bar at the top of any comp to temporarily hide it. Watch this short video to see how. Have a suggestion for a Tech ...
Tech Tip
Tech Tip: Delivery confirmation
A recent feedback request we got from a TOTAL user asked for confirmation that they’d delivered successfully to the correct client address the day ...
Tech Tip
Tech Tip: Having TOTAL check for client-specific wording
If you’ve ever been asked by a client to remove a word or phrase that could be considered biased or subjective, you can have TOTAL prompt you for ...

The Elite Advantage: An Interview with Bob
It’s no secret that TOTAL can easily save you time, but did you know you have access to personalized training to make the most of each product? At a ...
Tech Tip
Tech Tip: Titan Reports redelivery
First: have you ever had to make a quick change to a report, like removing a word or phrase, and then redeliver? In the Roadshow in OKC this past ...
Tech Tip
Tech Tip: Photo labels work differently in TOTAL, thanks to feedback!
TOTAL’s photo labels are now tied to the photo whenever you move or swap photos in the Photos PowerView – and it’s all thanks to feedback from ...
Tech Tip
UAD 3.6 Focus: Photos within the new URAR
Right now, appraisers are using photograph addenda, but the new URAR puts photos – especially conditionally-required ones – directly into the ...
Tech Tip
UAD 3.6 Focus: Putting defects into the UAD tables
The new UAD requires that defects, damage, and deficiencies be put into a table, tied in the dataset to the amenity itself. See how that might look ...

The Elite Advantage: An Interview with Janessa
If you haven’t taken advantage of our Elite product coaching, you’re missing out on a huge perk! Whether you’re new to TOTAL, or an experienced user, ...
Tech Tip
UAD 3.6 Focus: Amenities go into a table
The new UAD makes less use of freeform commentary and more use of selected data in tables. In this video, see how some of the subject amenities might ...
Tech Tip
UAD 3.6 Focus: Accommodating multiple addresses
The upcoming UAD changes will allow for multiple addresses in the report without needing to add commentary to your addenda. Watch this short video to ...
Tech Tip
Bias and subjective word check in TOTAL
Bias and subjective words can create post delivery aggravation. Check out this feature in TOTAL to expand bias and subjective word check to all ...
Tech Tip
UAD 3.6 Focus: The New dynamic fields
Our first in a series of Tech Tips about the new UAD dataset and report, we highlight a benefit of using dynamic reports. As you type in many fields, ...
News
The New UAD: An interview with Ken DeFeo
The New UAD: A CoreLogic interview with Ken DeFeo from Fannie Mae from CoreLogic | a la mode on Vimeo.
Tech Tip
Tech Tip: Vertical photos in TOTAL
TOTAL offers vertical photo pages with 4-photo and 2-photo options, useful for showcasing tall buildings or spaces with floor-to-ceiling features. ...
News
New Payment Plans for TOTAL Bundles
See our new payment plans We’re introducing a new way to pay for your TOTAL bundles — split payments through PayPal! We’ve heard your requests for ...
Tech Tip
Tech Tip: Driving comps with TOTAL for Mobile
When you’re in the field, TOTAL for Mobile shows you all your comps on a map, where you can launch right into driving directions!
Tech Tip
Tech Tip: Custom Angles
Measuring angles accurately in the field can be tricky, but assuming the angle is not acceptable. Watch this video (2:43) to learn how to accurately ...
Tech Tip
Tech Tip: Accurate Angles using Rise and Run
For this property, incorrectly assuming a bay window with 45 degree angles shorts the homeowner almost 65 square feet across this sketch.
Tech Tip
Tech Tip: Correct location maps, every time
Do you have to move map balloons around a lot, especially for new construction or rural assignments? See how to get 100% accurate location maps every ...
Tech Tip
Tech Tip: Remove a comp from weighting
Want to remove an active listing from your comp weighting? What about that comp you included at the behest of the client, or to bracket a feature – ...
News

Stay updated on UAD conversations
To keep you as updated as possible, we’re having constant discussions about the upcoming UAD changes with different CoreLogic teams. Here are some of ...
Tech Tip
Tech Tip: Swapping one major form to another
What if you’ve already started working on a report, and the client changes job (and form types) on you mid-stream – but you have data, like ...
Tech Tip: UAD Freeform for a faster grid
If you’ve got the current UAD basically memorized at this point, data entry might be faster in TOTAL if you turn on Freeform UAD mode – and in my ...
Tech Tip
Tech Tip: Suggested Value and Weighted Averages in TOTAL
If you use a weighted average for your sales comps, TOTAL can help you show your work by putting the calculations and a description into your ...
Tech Tip
Tech Tip: AI-Ready forms in TOTAL
See which of your forms will – and won’t – convert to AppraisalPort before you sign and go through the delivery process. Watch the video to see how.
Your UAD Questions, Answered.
So many questions were submitted during our webinars with Fannie Mae and Freddie Mac, and we couldn’t possibly answer them all in our allotted time. ...
Tech Tip – UAD Guide built into TOTAL
TOTAL has a built-in guide and dictionary of all the UAD requirements from the relevant GSE documentation for UAD. This way you don’t have to look it ...
Tech Tip
Tech Tip: Save a comp to your database manually
In some cases, it might be helpful to copy a comp from an in-progress report you’re working on to a new assignment in the same neighborhood. Watch ...
TOTAL for Mobile
Tech Tip: Call and text directly from TOTAL for Mobile
Forget looking up a phone number on paper – call or text the homeowner or agent directly from TOTAL for Mobile. Watch this video to see how. (:57)
TOTAL for Mobile
Tech Tip: Template photo pages on TOTAL for Mobile
Appraisers tend to prefer particular photo pages in particular places within the report – and TOTAL for Mobile has all your favorite photo forms ...
TOTAL for Mobile
Tech Tip: Driving directions in TOTAL for Mobile
Just having the addresses of potential comps gives you the ability to get driving directions in TOTAL for Mobile. See how in this short video. (:53)
Tech Tip: Changing area properties in a sketch
We’ve shown you how to modify an area’s line style and color to distinguish it in a report. But what if you want ALL your future balconies to have ...
A look back at 2023
There’s no way around it, 2023 was a tough year for appraisers. Mortgage rate increases and difficult market conditions meant there was less work to ...
Tech Tip
Tech Tip: Customize area lines in your sketch
Sketches can sometimes get complex. One of the ways to visually distinguish between two areas is to change the pattern of the lines for one of them. ...
Tech Tip
Tech Tip: New calculated area in your sketch
Sometimes, you may need to either show or calculate the square footage or perhaps demonstrate the exact placement of an area on the sketch. Watch ...
Tech Tip
Tech Tip: Select a pop point for your sketch
When using TOTAL Sketch, you can select the pop point you want to connect to by hovering the mouse over any pop point. You’ll see a red line ...
The Future of UAD: What lenders want from you
Chief Appraiser Shawn Telford and Joel Baker from CoreLogic talk the new and upcoming UAD dataset with Scott Reuter from Freddie Mac.
Tech Tip
Tech Tip: Squaring your sketch with Pop Points
To help you assure squaring off properly, TOTAL Sketch shows you pop points. You can see them when you’re in Draw mode. The red and blue dots show ...
Tech Tip
Tech Tip: Alt+F10 to move dimensions in or out of an area
It’s easy in TOTAL Sketch to move ALL the dimension labels for an area into our outside of the area. Watch this short video to see how (1:06).
TOTAL
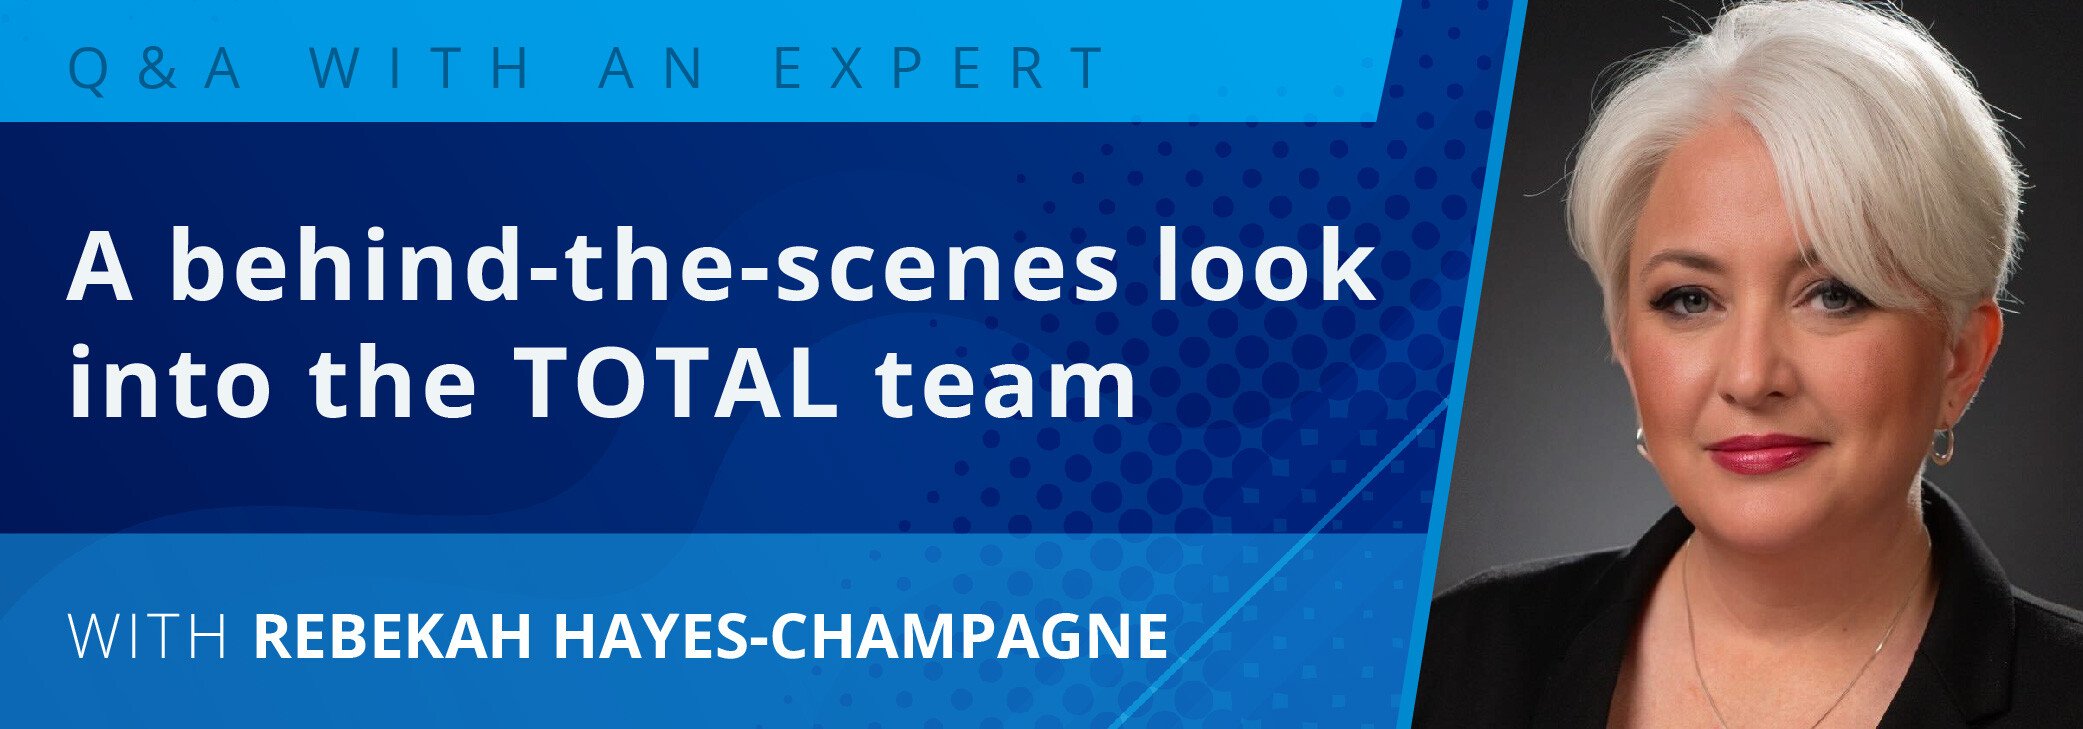
Q&A with our resident TOTAL Expert
You hear a lot about our products, new features, and the industry, but what you might not know is who is behind the scenes making your technology ...
Tech Tip
Tech Tip: Direction of Drawing on your Sketch
We’re commonly asked how to make an area’s dimension labels go inside or outside of an area. You can control how it looks when you’re drawing the ...
News
The Future of UAD webinar with CoreLogic and FNMA
CoreLogic Chief Appraiser Shawn Telford and Joel Baker talk to Fannie Mae’s Lyle Radke about the Future of UAD and when appraisers will need to be ...
Tech Tip
Tech Tip: Shading areas in your sketch
One way to easily set your reports apart visually and help a reader understand a sketch better is by shading or colorizing areas.
Tech Tip
Tech Tip: Select your Assessor’s parcel number format
Use TOTAL’s Subject Public Records lookup to specify which version of the Assessor’s Parcel Number you’d like to use.
Tech Tip
Tech Tip: “Push” data across the grid with F2
Stop typing the same piece of grid data over and over, and “push it” to other comps with TOTAL’s F2 keyboard shortcut. Watch here to see how. (0:40)
Tech Tip
Tech Tip: Hide pages in TOTAL’s scrolling forms view
Collapse any page of any form in TOTAL to scroll right by it when viewing your reports. Watch this short video to see how: (0:52)
Tech Tip
Tech Tip: Set up autocorrect in TOTAL
The next time you misspell a word for what seems like the thousandth time, just add it to TOTAL’s Autocorrect.
Tech Tip
Tech Tip: Autofill “No AMC” on Page 6 in a report
Stop typing NO AMC manually and locking the field. TOTAL can do this for you automatically.
ScanToSketch
The appraiser behind ScanToSketch
Appraisers have already used ScanToSketch to generate over 10,000 reports with this innovative new tool. We sat down with Kevin Cheung, a seasoned ...
TOTAL for Mobile
Tech Tip: Unlock hands-free data entry in TOTAL for Mobile
Did you know that you can save yourself from the headache of typing when you’re at a property? It’s true! You can use speech-to-text to complete any ...
Elite
Tech Tip: Is this the homeowner’s mobile number?
How can you tell if your appointment text confirmations are being sent to a homeowner’s mobile number? If you’re using ScheduleAssist, you’re ...
TOTAL
Tech Tip: See your inspection status in the file manager
When you’re using ScheduleAssist, you can see the appointment time and completion status of all of your appointments in TOTAL.
Elite
Tech Tip: Right-click to launch ScheduleAssist
It takes just two clicks to open ScheduleAssist in TOTAL — allowing you to easily schedule appointments with homeowners and set up automatic reminder ...
Tech Tip
Tech Tip: Rush orders with ScheduleAssist
When you add a rush appointment to your calendar with ScheduleAssist, it automatically works around all of your other appointments to find the best ...
Comps
Tech Tip: Create a comps-only map in TOTAL
When deciding which comps to use in a report, or even which comps to put first, it’s often helpful to see them on a map, to visualize where each ...
Tech Tip: Email just an invoice to a client
Use TOTAL’s Assignment PowerView to print and send just an invoice to your client; no need to uncheck all the other forms in your report!
Elite
New updates in ScheduleAssist!
We’ve been hard at work adding all kinds of improvements and updates to our new appointment scheduling tool, ScheduleAssist!
ScheduleAssist
Tech Tip: Customize text templates with ScheduleAssist
Have you checked out ScheduleAssist yet? You can use it to automatically send reminders to your clients. We’ve created some templates for you to ...
Tech Tip: Automatically send reminder texts to your inspection contacts with ScheduleAssist
Help your clients remember their appointments by automatically sending them text messages through ScheduleAssist. It just takes a couple of clicks to ...
Tech Tip
Tech Tip: Customize a contact’s “branch” to easily find it
You can use a company contact’s branch field for pretty much any description that helps you identify which company contact you’re looking at.
ScheduleAssist
Tech Tip: Flexible Timeslots in ScheduleAssist
Need a little more time in between appointments today for that complex assignment? Less time between because all you have are drive-bys today? ...
Tech Tip
Tech Tip: See your appointments on your mobile device automatically with ScheduleAssist
With ScheduleAssist, your appointments are instantly mobile, linked to either a Google or Microsoft calendar.
TOTAL
Tech Tip: Change Case in Selected Fields
Has this ever happened to you? You start a report from an order file, and some data imports in all capital letters. Going back and manually re-typing ...
TOTAL
Tech Tip: Checking Form Compatibility with ENV
In a previous video, we showed how to find ENV-compatible forms to add to your reports. But what if you’ve already done several days of work and want ...
Tech Tip
Tech Tip: Using ENV Compatible Forms
Delivering your report in the ENV format requires the use of compatible forms in TOTAL. A single checkbox ensures you’re using the correct forms, ...
TOTAL for Mobile
Tech Tip: Turn the sketching grid off in TOTAL for Mobile
Sometimes lighting conditions on-site make it hard to see the lines you’re drawing or where your cursor is while sketching in TOTAL for Mobile. One ...
TOTAL for Mobile
Tech Tip: Assessor Data on Mobile
Often appraisers will print out Property Data to carry with them before going out on an inspection. What a hassle! Save time and paper by dragging it ...
Tech Tip
Tech Tip: Mobile QuickNotes
Sticky notes are handy. They’re useful in all sorts of situations. But they’re one more thing you have to carry when out on an inspection. What if ...
Tech Tip: Vertical photos in TOTAL
TOTAL offers vertical photo pages with 4-photo and 2-photo options, useful for showcasing tall buildings or spaces with floor-to-ceiling features. ...
TOTAL for Mobile
Tech Tip: Keep track of details room-by-room in TOTAL for Mobile
You can easily add photos to your report as you label the rooms on your sketch in TOTAL for Mobile. Check out this tech tip to see how to organize ...
Tech Tip
Tech Tip: Using E&O with multiple monitors
Your E&O PowerView works best when making use of TOTAL’s built-in multiple monitor functionality. You get all the warnings and errors in the ...
Tech Tip
Tech Tip: Adjusting Suggested Value and Weighted Averages in TOTAL
If you want to give more weight to some comps over others, TOTAL can do it for you automatically or you can do it manually. You can also clearly ...
ScheduleAssist
ScheduleAssist updates
We’ve started the release of our new product, ScheduleAssist, and appraisers are already seeing improvements to their scheduling workflow! If you ...
Tech Tip
Tech Tip: Add commentary about weighted averages to your addendum in TOTAL
When you use a weighted average, you’ll want to explain what you did and why to your client. You can do this by quickly adding commentary to your ...
Tech Tip
Tech Tip: Remove a comp from weighting in TOTAL
Occasionally you’ll need to include comp you don’t want to impact your weighting. It’s easy to remove in TOTAL using the Suggested Value Calculations ...
Comps
Tech Tip: Automatically weigh your comps in TOTAL
Do you move the most similar sales comps to the lower-numbered slots? Let TOTAL help you do this automatically with a single click. It’s one of the ...
Tech Tip
Tech Tip: Organize your files with folders
Sort your files to meet your own needs and make them easy to find. You can create new folders in TOTAL to organize them in a way that works for your ...
Tech Tip
Tech Tip: Find your area-specific reports in TOTAL
Need to find your reports from a specific neighborhood or location? The advanced map search feature in TOTAL makes it easy to find your own ...
Tech Tip
Tech Tip: Delete, but never lose a comp
Do you pull more comps than you need and eventually delete the unused ones? TOTAL makes it easy to save all of your comps along with their photos and ...
TOTAL for Mobile
Tech Tip: Correctly place your maps in TOTAL for Mobile
Do your locations end up in the wrong place when you add them to your maps? With one tap in TOTAL for Mobile, your phone’s GPS can put them in the ...
TOTAL for Mobile
Tech Tip: Square off your sketch in TOTAL for Mobile
What’s the best way to know your sketch is accurate BEFORE you leave a subject? It’s to square off your measurements using plot points and .the call ...
TOTAL for Mobile
Tech Tip: Customize your angles in TOTAL for Mobile
When you measure an angle, adding it to your sketch shouldn’t be frustrating. Adding custom angles in TOTAL for Mobile takes just a couple of clicks, ...
TOTAL for Mobile
Tech Tip: Accurately measure and draw angles in TOTAL for Mobile
If you measure a home inaccurately, you could possibly short the square footage by dozens of square feet. The rise and run feature in TOTAL for ...
Tech Tip
Tech Tip: Add a fee quote page to your XSite
During this market slowdown, many appraisers like you are looking for ways to attract new clients. An XSite makes it easy for potential clients to ...
Tech Tip
Create custom paragraphs in your addendum with QuickLists
Use QuickLists to create custom paragraphs in your addendum and save yourself from repeatedly typing the same things over and over. Check out today’s ...
Sketching is about to get a whole lot easier
LiDAR sketching is coming to TOTAL for Mobile soon and we’re excited to start getting this new technology in your hands.
Tech Tip: Include a multi-year market analysis in your report with Titan Analytics
Do you need to include data from years ago in your report? Titan Analytics allows you to use all of the property data and helps you add it in ...
Tech Tip
Tech Tip: Create an insights addendum with QuickSource
While building your report, you may notice things that could cause your clients to send it back for revision requests. With QuickSource, you can ...
Tech Tip
Tech Tip: Personalize your MLS and Public Records data rules in QuickSource
There may be things in your MLS or Public Records that don’t match your personalized grid formatting, but it takes just a few clicks in QuickSource ...
Tech Tip
Tech Tip: QuickSource Insights — leave yourself notes and reminders
Notice something in your data you’ll want to dig into or explain later? QuickSource makes it easy for you to see where you’ve left yourself ...
Tech Tip
Tech Tip: Predict and avoid revision requests
The best revision request is the one you never get. QuickSource helps you see discrepancies and explain them before you deliver to your client.
Tech Tip
Tech Tip: Customizing the link to your website on Google
Customizing your website in just a few places can make it a lot easier for potential non-lender clients like attorneys, accountants, and homeowners ...
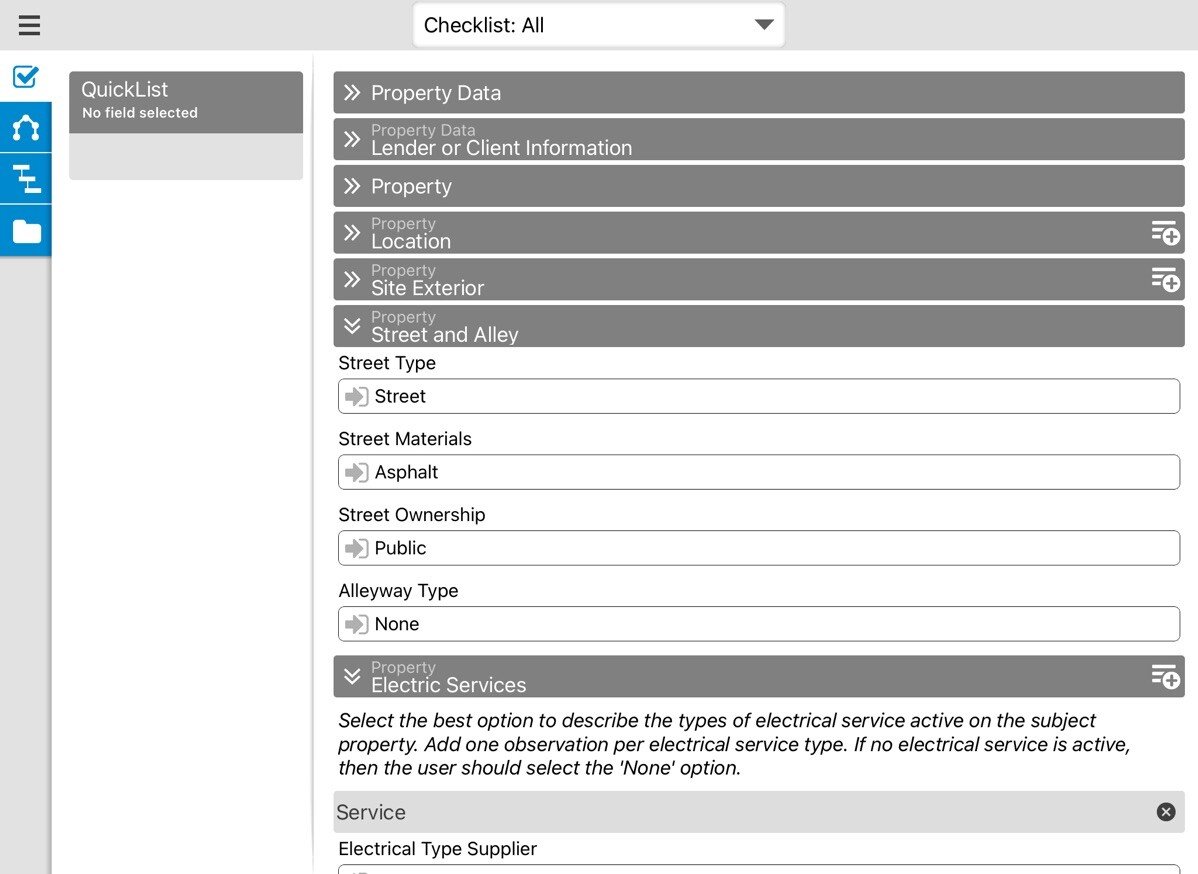
New PDR form released in TOTAL for Mobile
Appraisers, appraiser trainees, and other appraisal staff members can now use the free TOTAL for Mobile app to deliver Property Data Reports (PDRs) ...
Titan Analytics
Titan Analytics updates: Automatic comp detection, additional upload options, and more
We’re happy to announce some exciting updates to Titan Analytics based on your feedback! It’s now smarter, easier to use, and more flexible. If ...
Tech Tip
Tech Tip: Explain data discrepancies before a revision request even happens
Sometimes you know when you’re going to get a revision request before you send your report to a client. With QuickSource insights, you can write up ...
Tech Tip
Tech Tip: Prioritize MLS or public records, field by field in QuickSource
You know which of your data sources have the most accurate information for your grid. With QuickSource, you can select how to fill out each field in ...
QuickSource
Updates to QuickSource and MLS Mapper
QuickSource and MLS Mapper improvements include new features, improved performance, and more customization options
Tech Tip
Tech Tip: Recent reports in Titan Drive
Are you working on the newest version of your report? Titan Drive will tell you if you’re not.
Tech Tip: TOTAL’s weighted average and suggested value tool
Do you give more weight to some comps than others? TOTAL’s suggested value helps you do this automatically based on the amount of adjustments in the ...
News
Property Data Report (PDR) Update
Recently, Freddie Mac announced that starting July 17, 2022, they’ll transition from offering automated collateral evaluation (ACE) appraisal waivers ...
Tech Tip
Tech Tip: Weighted average table and automatic addenda commentary
When you use TOTAL’s weighted average feature to help you with your opinion of value, it’s important – and really easy – to explain in the addendum ...
Tech Tip
Tech Tip: Remove a comp from weighting
Want to remove an active listing from your comp weighting? What about that comp you included at the behest of the client, or to bracket a feature – ...
Tech Tip: Automatic comp weighting
Do you move the most similar sales comps to the lower-numbered slots? Let TOTAL help you do this automatically with a single click. TOTAL gives each ...
Tech Tip: Adjustment rounding made easy
Use TOTAL’s global rounding setting to permanently set the rounding for all adjustments. Watch this video to see how…
News
Desktop appraisals: Ready to support you
As you’ve likely heard, the GSEs have announced that a new desktop appraisal process will now be an option for some loan transactions as early as ...
Tech Tip
Tech Tip: Cutting out areas in your sketch (TOTAL for Mobile)
Need to cut out a loft or other negative living area when working on your sketch? You can easily do it while you’re in the field with TOTAL for ...
Tech Tip
Tech Tip: Predicting revision requests
If you spot a data point in MLS, public records, or peer data that is likely to come back to you as revision request, note it in QuickSource for ...
News
2021 Year in Review
2021 was another exciting and successful year for a la mode customers. We appreciate you trusting us with your business, and we’re happy to continue ...
Tech Tip
Tech Tip: Flagging discrepancies for later review
Do your data sources disagree? Do you need to flag a data point for further review or investigation later?
QuickSource

The top misconception about QuickSource (and the #1 reason to use it)
As many of you know, we recently launched a new data validation tool called QuickSource, and we wanted to address one of the most common ...
QuickSource

New in QuickSource: Google Maps, Speed Enhancements, Insights, Notes, and More!
What an exciting time it’s been since launching QuickSource free-time to all our customers! We’ve loved hearing your feedback, and we continue to ...
News

QuickSource pricing, free trial, and more
QuickSource has officially launched! We’re excited to announce that QuickSource is now available (free for a limited time) to all our U.S. based ...
Tech Tip
Appraiser Tech Tip: Public records for comps with QuickSource
QuickSource automatically shows you public records data for every comp, side by side with your MLS data and peer data. It’s easy to verify and ...
Tech Tip
Appraiser Tech Tip: Faster UAD fields with FreeForm UAD mode in TOTAL
Have you got UAD pretty much memorized at this point? I mean, it’s been a decade!
Tech Tip
Tech tip: Driving comps with TOTAL for Mobile
Use TOTAL for Mobile to see all your comps on a map, and send an address to Google Maps for routing. Watch this short video to see how.
QuickSource
Tech Tip: Comp selection and validation in QuickSource
With QuickSource, you do your comp vetting and selection from just one screen, seeing all data sources at once. You can:
Tech Tip
Tech Tip: Pull correct location maps, 100% of the time
Are you still spending time moving balloons around on your maps whenever you’re pulling location maps for new construction or more rural properties?
Tech Tip
Tech Tip: Stop typing your MLS data into your reports
Are you still re-typing all your comp data from the MLS into your grid, manually? Comp after comp, report after report?
Tech Tip
Tech Tip: Make quick report changes and redeliver from an iPad
Take care of simple file changes and redeliver your reports – using Chrome or any other browser, from an iPad or any computer. No TOTAL installation ...
QuickSource

QuickSource update: Your feedback in action!
Haven’t heard about QuickSource yet? No sweat, watch this video. Want to request free, early access? Let us know here.
Tech Tip
Tech Tip: Configuring your MLS for QuickSource
Good morning! This is a tech tip specifically for those of you who are a part of the pilot for QuickSource.
Tech Tip
Tech Tip: Custom paragraphs as QuickLists in your addendum
TOTAL’s addenda QuickLists let you save paragraph-size common responses. Once you write something in the addendum for one report, you can save it for ...
Tech Tip
Tech Tip: Stop emailing TOTAL reports to yourself
For most of us, gone are the days of carrying around a flash drive with our current TOTAL file and digital workfiles – or of exchanging flash drives ...
A note to our customers: CoreLogic enters into a definitive agreement
Today, it was announced that CoreLogic has entered into an agreement to be acquired by Stone Point Capital and Insight Partners, two leading private ...
News
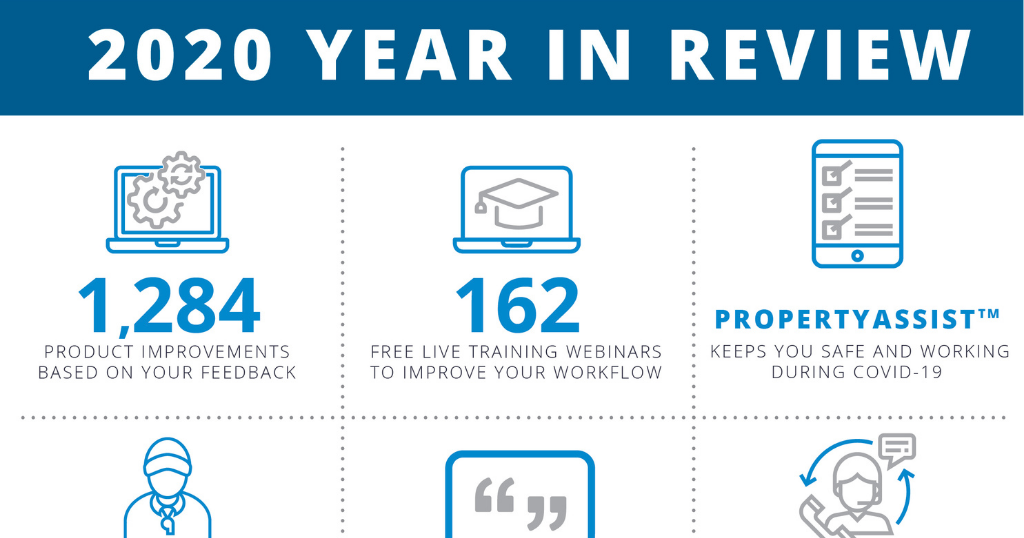
2020 Year in Review
It’s easy to look back at this year and instantly focus on the negatives. But I think we’ve all had more than enough of that. So, let’s recap some of ...
a la mode
Click, ask, and get answers
Unless you simply enjoy our groovy elevator music, you’d probably rather skip waiting when calling in with a simple how-to question. That’s why we ...

Public Records Data: Updates, feedback, and tips
We recently gave all our TOTAL customers in the US the ability to import Public Records data directly into their report — free for a limited time.
News

Celebrating 35 Years
It was July, 1985. Back to the Future premiered in theaters, the original Nintendo made its debut in the US, and a la mode began its mission of ...
TOTAL
New to Titan Analytics: Creating custom graphs
You provided feedback, and we heard you! We’ve made exciting updates to Titan Analytics. These new improvements offer clearer support for your ...
TOTAL
New to PropertyAssist®
This week, we’re releasing more improvements based on your feedback. We think you’ll appreciate these new items that should address some of the ...


.png)

